


Offizieller Lieferant
Als offizieller und autorisierter Distributor beliefern wir Sie mit legitimen Lizenzen direkt von mehr als 200 Softwareherstellern.
Sehen Sie alle unsere Marken.
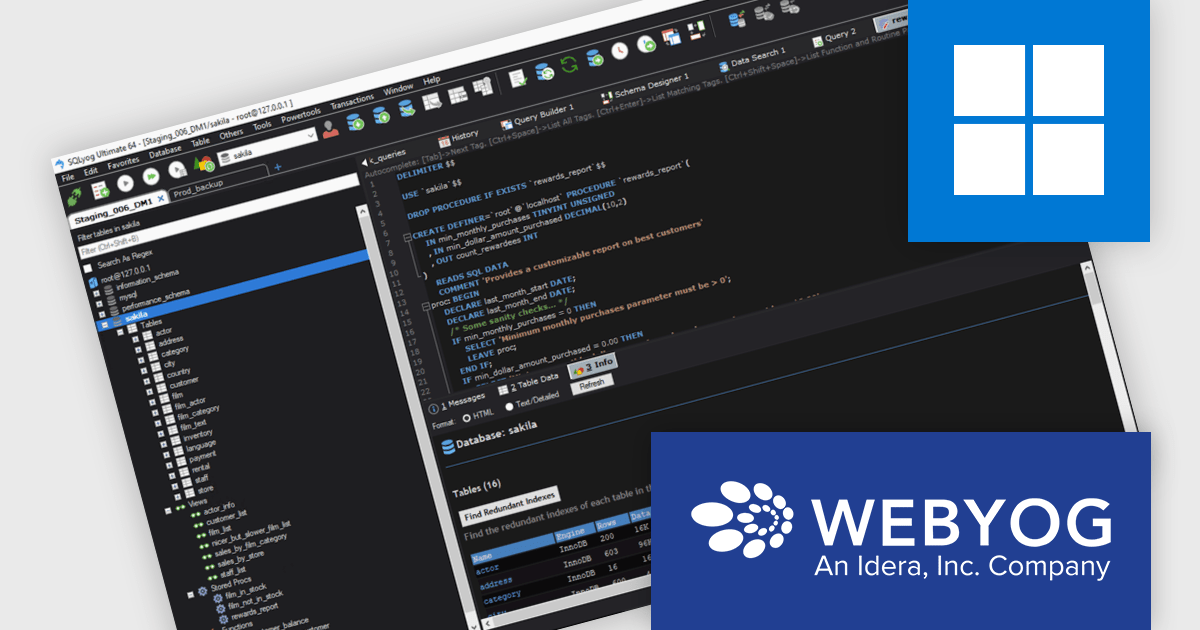
SQLyog Ultimate offers a responsive and lightweight graphical environment for both visual database management and direct SQL scripting. It helps users handle complex operations like database synchronization, query profiling, and performance tuning with greater ease. Whether used by solo developers or large teams, SQLyog Ultimate provides a dependable and adaptable solution for building, managing, and debugging MySQL databases accurately and efficiently.
The SQLyog 13.3.1 update introduces a new Dark Theme that enhances the development experience by providing an eye-friendly interface optimized for long work sessions. This update helps reduce visual fatigue during extended database management tasks and delivers a cleaner, more modern environment that aligns with the visual preferences of many developers. It represents the first stage of SQLyog’s broader dark mode rollout, laying the groundwork for further interface customization and usability improvements in future releases.
To see a full list of what's new in version 13.3.1, see our release notes.
SQLyog Ultimate is licensed per user with a perpetual license that includes one year of free upgrades and one month of installation support. See our SQLyog Ultimate licensing page for full details.
For more information, visit our SQLyog Ultimate product page.
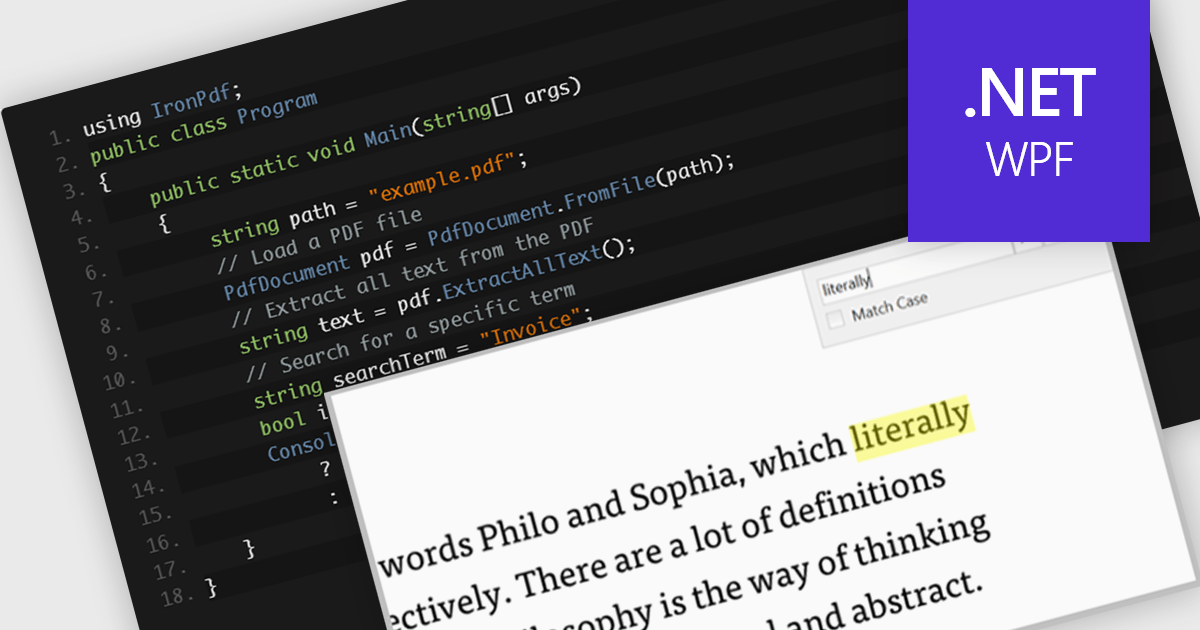
A text search feature in a PDF component allows developers to programmatically locate specific words or phrases within a PDF document. This functionality typically supports options such as case sensitivity, whole word matching, and navigation between search results. It is particularly useful in applications where users need to quickly identify and interact with relevant content in large or complex documents. By enabling this feature, developers can enhance the user experience in document viewing or editing environments, reduce manual search effort, and support features like text highlighting, annotation, or content extraction for further processing.
Several .NET WPF PDF components offer text searching including:
For an in-depth analysis of features and price, visit our .NET WPF PDF components comparison.
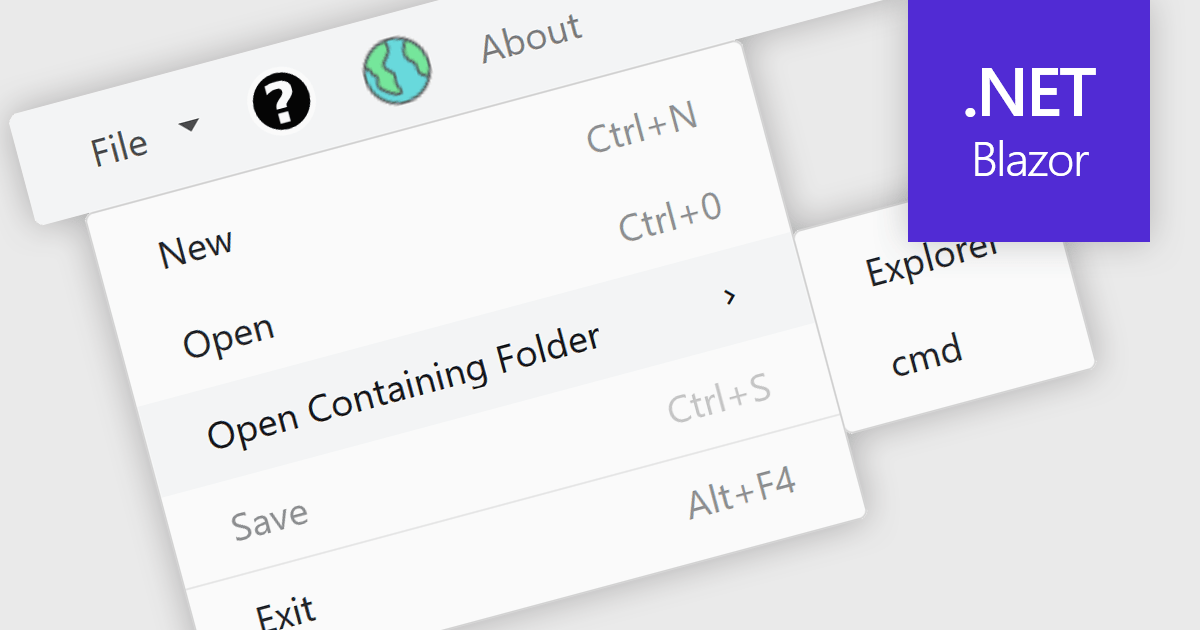
Menu controls in a Blazor UI suite are user interface components that provide structured navigation through an application by organizing links or actions into hierarchical menus. These controls are particularly useful in web applications that require intuitive, accessible, and dynamic navigation elements. In Blazor, menu controls can be rendered either through server-side or WebAssembly-based components, allowing developers to build interactive menus using Razor syntax and C#. They support features like multi-level nesting, icons, templates, and binding to data sources, making them adaptable to a wide range of layouts and user experiences. Menu controls integrate smoothly with routing and layout systems, enabling developers to maintain a consistent navigation experience across the application.
Several Blazor UI suites provide Menu controls, including:
For an in-depth analysis of features and price, visit our comparison of Blazor UI Suites.
Stimulsoft BI Cloud is a cloud-based business intelligence platform that allows organizations to create, manage, and share interactive dashboards and reports. By offering a user-friendly interface and a wide range of data visualization tools, Stimulsoft BI Cloud enables users to gain valuable insights from their data, make informed decisions, and improve overall business performance.
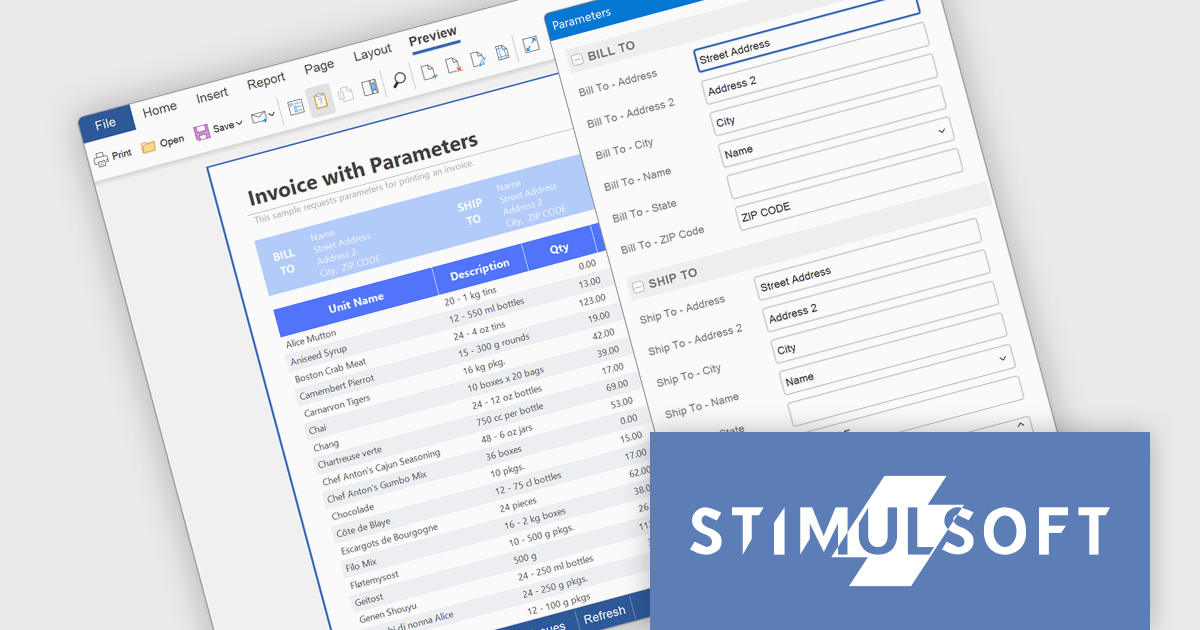
The Stimulsoft BI Cloud 2025.4.1 update introduces a new Parameters dialog that enhances control and flexibility when generating reports and dashboards. By displaying parameters in a dedicated dialog window, developers can ensure users review and confirm their input values before report execution. This approach prevents unnecessary data loading, maintains dashboard visibility during parameter entry, and supports a more structured and efficient workflow for report generation and testing.
To see a full list of what's new in 2025.4.1, see our release notes.
Stimulsoft BI Cloud is available as a perpetual license and is licensed per creator. A creator has an account on the server, has access from the client-side, registered as an editor, and uses the product to work with report templates and dashboards - create, edit, view, delete, etc. See our Stimulsoft BI Designer licensing page for full details.
Stimulsoft BI Cloud is available individually or as part of Stimulsoft Ultimate.
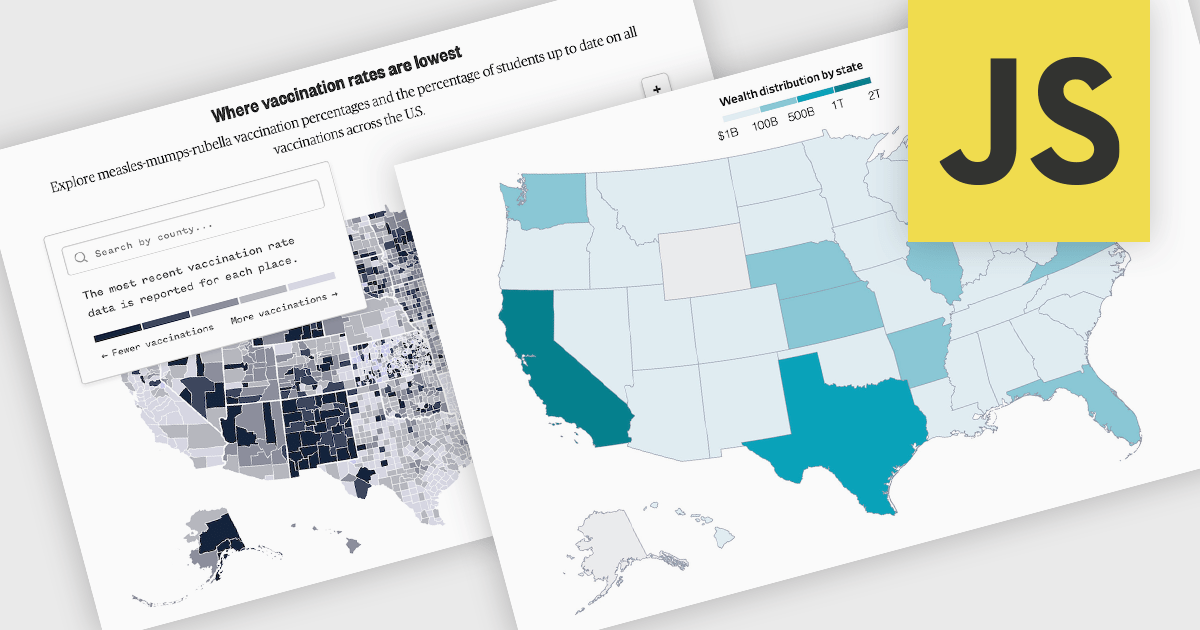
A map chart is a data visualization tool that displays information across geographic regions, helping users uncover spatial patterns, trends, and relationships. By plotting values onto countries, states, or custom areas, it transforms complex datasets into clear, location-based insights. Features like color-coding, zooming, and drill-down navigation allow for interactive exploration and comparison across regions. Common use cases include analyzing sales performance by region, tracking market coverage, visualizing customer distribution, or monitoring demographic trends, all of which support data-driven decision-making with a strong geographic context.
Several JavaScript chart controls offer map charts including:
For an in-depth analysis of features and price, visit our JavaScript chart controls comparison.


Tel.: (888) 850 9911
Fax: +1 770 250 6199


