


Offizieller Lieferant
Als offizieller und autorisierter Distributor beliefern wir Sie mit legitimen Lizenzen direkt von mehr als 200 Softwareherstellern.
Sehen Sie alle unsere Marken.

Rider by JetBrains is a cross-platform integrated development environment (IDE) tailored for .NET developers. Combining the power of ReSharper with the IntelliJ platform, it delivers a fast and feature-rich experience for editing, debugging, and testing .NET, ASP.NET, Unity, and more. Rider supports a wide array of languages and project types, allowing developers to work seamlessly across codebases. With intelligent code analysis, version control integration, and a responsive UI, Rider helps developers maintain high code quality and productivity in diverse development environments.
The Rider 2026.1 update introduces mixed-mode debugging on Windows, enabling developers to debug both managed (.NET and .NET Framework) and native (C/C++) code within the same session. This is particularly valuable for applications that bridge managed and native components, such as those integrating .NET with native libraries or game engines.
To see a full list of what’s new in version 2026.1, see our release notes.
Rider is licensed per user, and is available as a commercial annual subscription license. We can supply new subscriptions, subscription renewals, lapsed renewals, and additional user licenses. See our Rider licensing page for full details.
Rider is available to purchase in the following products:
Syncfusion Essential Studio Enterprise provides a comprehensive collection of UI components and frameworks for building modern cross-platform applications. It offers over 1,800 components compatible with .NET WinForms, WPF, ASP.NET Core & MVC, WinUI, MAUI, JavaScript, Blazor, and more, enabling seamless application development across diverse devices and operating systems.
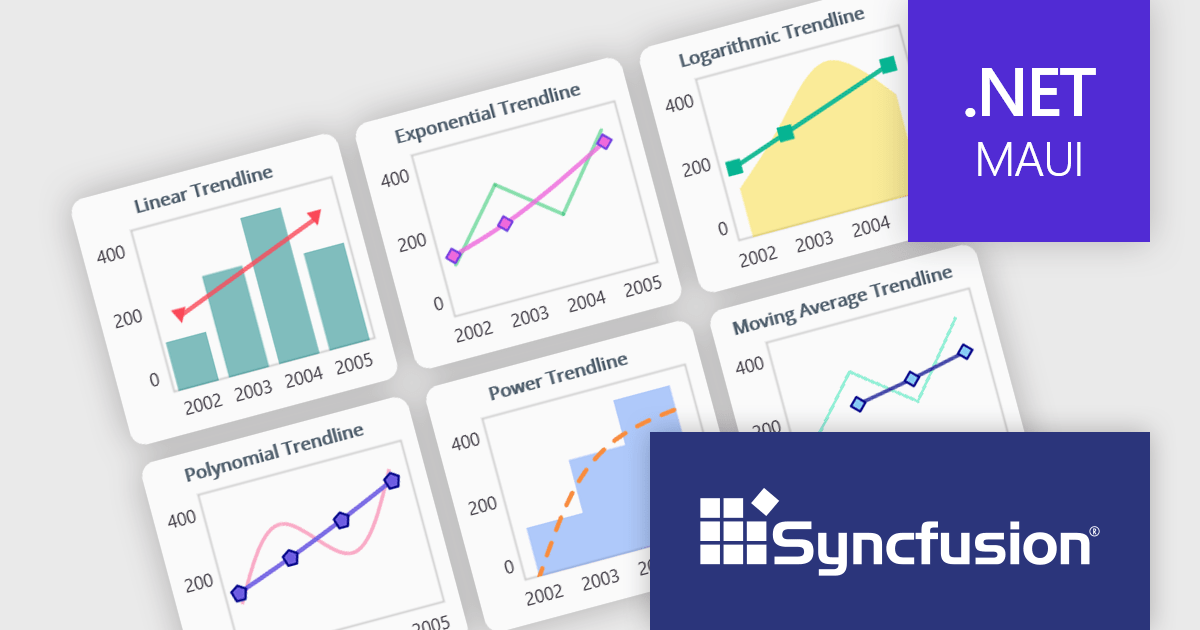
The Syncfusion Essential Studio 2026 Volume 1 update introduces trendline support to its MAUI charts, enabling developers to incorporate analytical context directly into data visualizations by applying linear, exponential, power, and polynomial models to chart series. This functionality allows applications to present clearer data patterns, support basic forecasting, and improve interpretability without requiring additional data processing logic or external tools, helping developers deliver more informative, insight-driven user experiences.
To see a full list of what's new in 2026 Volume 1 (33.1.44), see our release notes.
Syncfusion Essential Studio Enterprise is licensed per developer and is available as a 12 Month Timed Subscription License which includes support and maintenance. See our Syncfusion Essential Studio Enterprise licensing page for full details.
Learn more on our Syncfusion Essential Studio Enterprise product page.
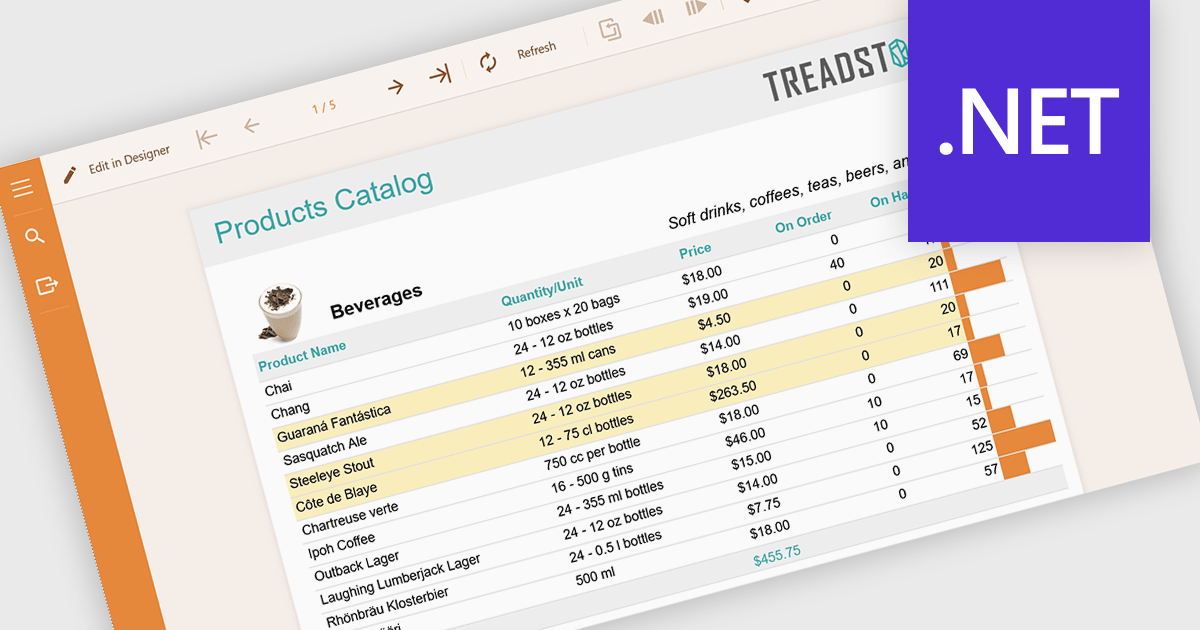
Conditional formatting in reports refers to the automatic application of visual styles such as colours, icons, or data bars based on specific rules or values within the data. This technique enhances reporting by making key information immediately visible, improving readability, and enabling faster, more informed decision making. By dynamically highlighting thresholds, trends, and anomalies, conditional formatting reduces the need for manual analysis while ensuring consistency across reports. Common use cases include flagging underperforming KPIs in financial dashboards, highlighting overdue tasks in project reports, visualising sales performance against targets, and identifying outliers in large datasets. Overall, it transforms static data into intuitive, actionable insights that are easier for users to interpret at a glance.
Several .NET reporting components allow you to apply conditional formatting, including:
For an in-depth analysis of features and price, visit our comparison of .NET reporting components.
CLion, by JetBrains, is a robust Integrated Development Environment (IDE) tailored for C and C++ development, with support for other languages like Python, Kotlin, and Rust via plugins. Designed for software developers and embedded engineers, it improves coding with features like intelligent code completion, real-time analysis, and an advanced debugger. CLion integrates seamlessly with tools like CMake, version control systems, and remote development setups, making it ideal for cross-platform and performance-critical projects. By automating repetitive tasks and enhancing code quality, it helps developers focus on innovation and problem-solving.
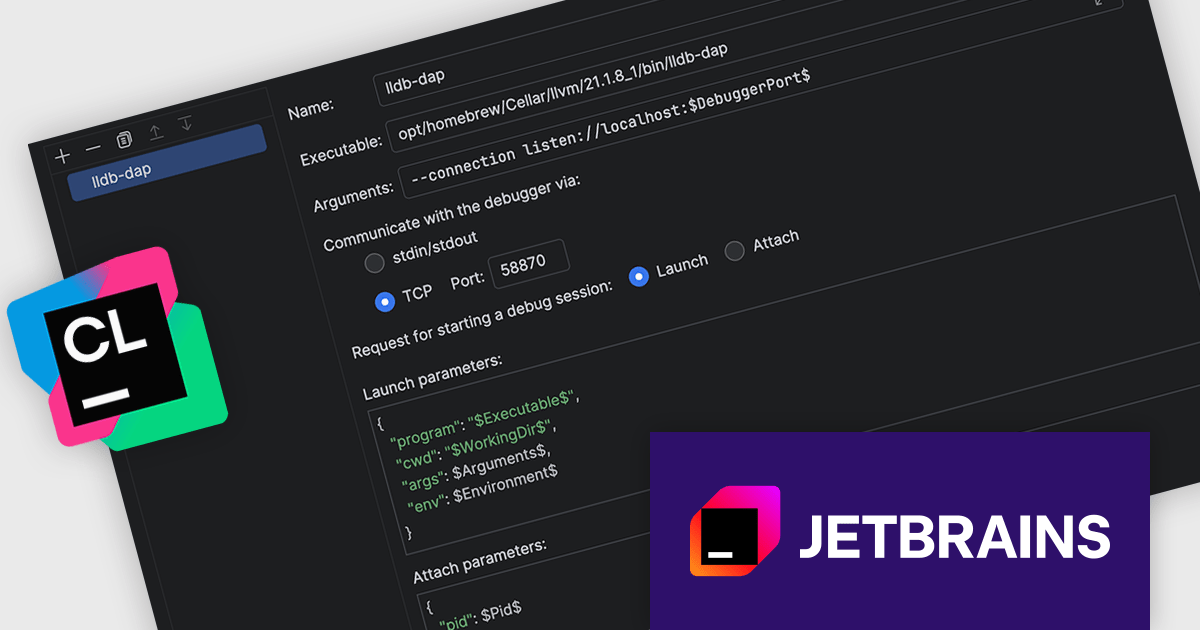
The CLion 2026.1 update now supports TCP connections to debuggers that implement the Debug Adapter Protocol (DAP), giving developers greater freedom in how and where they debug applications. This capability makes it possible to integrate external or remote debugging tools more easily, whether running on different machines, containers, or custom environments.
To see a full list of what's new in version 2026.1, see our release notes.
CLion is licensed per user as a commercial annual subscription. We can supply New Subscriptions, Subscription Renewals, Lapsed Subscription Renewals, and Additional Developer Licenses. See our CLion licensing page for full details.
CLion is available to buy individually or as part of JetBrains All Products Pack.
JetBrains WebStorm is a powerful and modern Integrated Development Environment (IDE) specifically designed for web development. It offers a feature-rich environment that supports popular web technologies like JavaScript, HTML, CSS, and Node.js. WebStorm helps you write cleaner, more efficient code with features like syntax highlighting, auto-completion, code refactoring, and built-in testing tools. It integrates seamlessly with various web frameworks and libraries, making it a versatile choice for both front-end and back-end development.
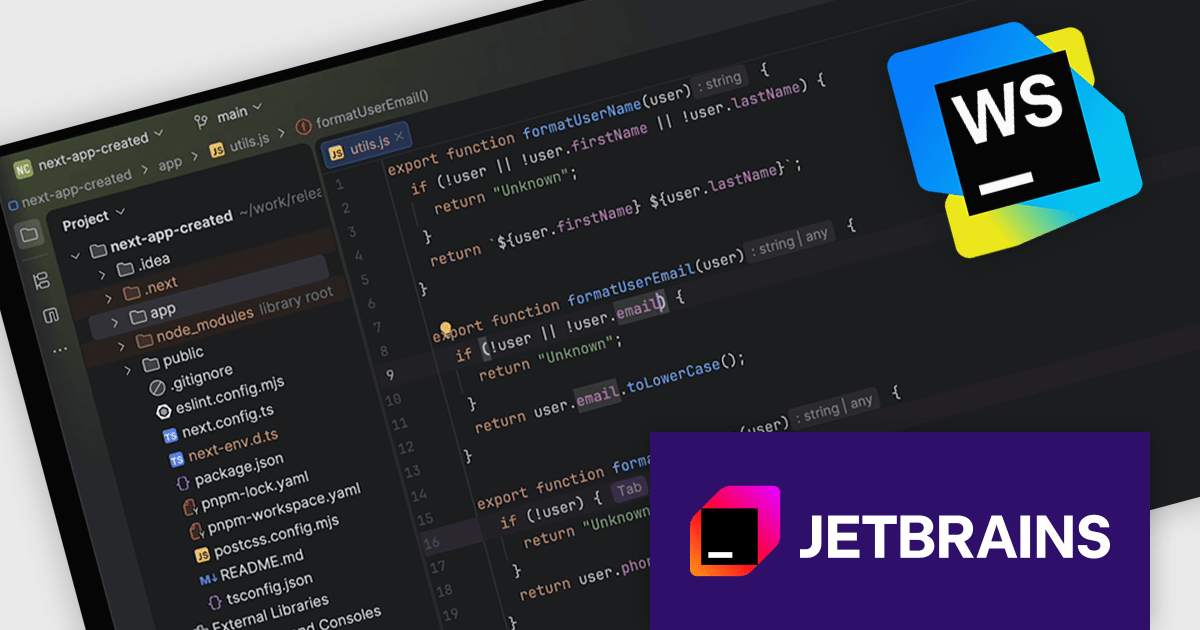
The WebStorm 2026.1 update enhances code editing with 'next edit' suggestions that understand the broader context of a file and apply related updates wherever they are needed. Rather than limiting changes to a single location, it ensures consistency across multiple sections of code, which is particularly valuable when refactoring or updating shared patterns. With support for JavaScript, TypeScript, HTML, and CSS, it helps developers maintain clean, cohesive codebases while reducing repetitive manual edits.
To see a full list of what's new in version 2026.1, see our release notes.
WebStorm is licensed per user, and is available as a commercial annual subscription license. We can supply new subscriptions, subscription renewals, lapsed renewals, and additional user licenses. See our WebStorm licensing page for full details.
WebStorm is available to buy in the following products:


Tel.: (888) 850 9911
Fax: +1 770 250 6199


