


Offizieller Lieferant
Als offizieller und autorisierter Distributor beliefern wir Sie mit legitimen Lizenzen direkt von mehr als 200 Softwareherstellern.
Sehen Sie alle unsere Marken.
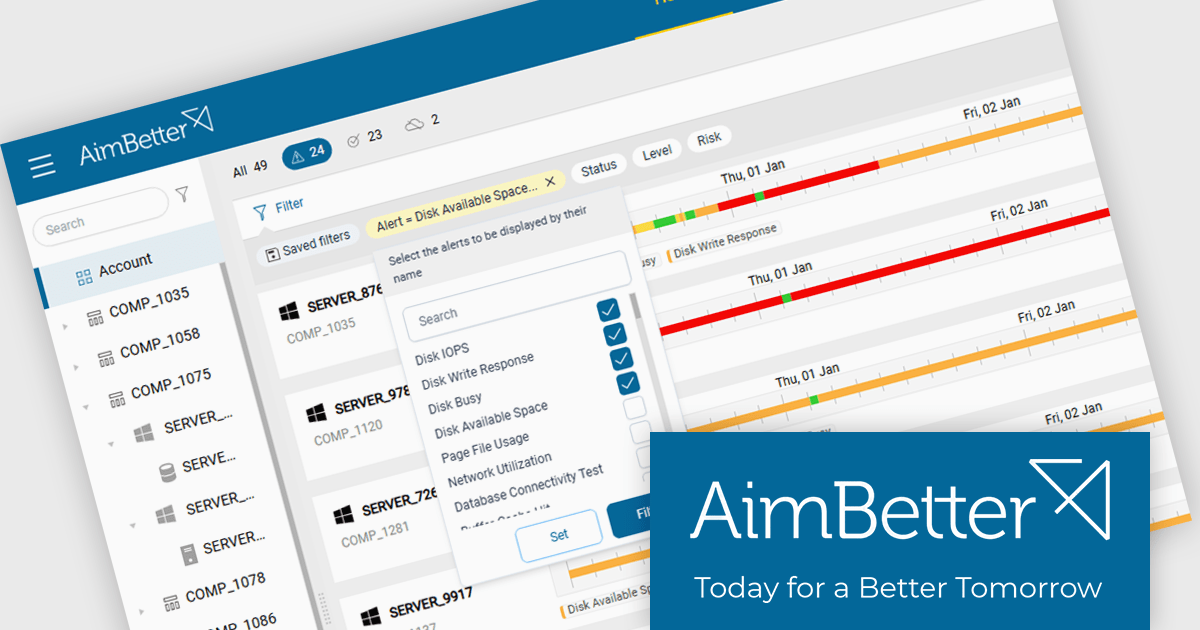
AimBetter is a comprehensive performance monitoring and optimization platform designed for database management systems (DBMS). It provides real-time diagnostics and analytics, allowing IT professionals to identify and resolve performance issues quickly and efficiently. By offering detailed insights into database operations, AimBetter enhances system stability, boosts performance, and reduces downtime. The platform supports various database environments and integrates with existing infrastructure, ensuring continuous monitoring and proactive management. Its user-friendly interface and advanced alerting mechanisms enable prompt action on critical issues, thereby optimizing resource utilization and improving overall operational efficiency.
The AimBetter March 2026 update now supports global filters that can be applied across all monitored servers simultaneously. This allows database administrators and operations teams to quickly narrow the alert view when investigating issues such as high CPU usage, disk pressure, or problematic queries. By filtering active alerts across the entire environment in a single action, it becomes easier to identify patterns, isolate affected systems, and focus on the most relevant incidents without reviewing each server individually.
To see a full list of what's new in the March 2026 update, see our release notes.
AimBetter is licensed per instance/per year with different plans available dependent on the services you require. See our AimBetter licensing page for full details.
Learn more on our AimBetter product page.
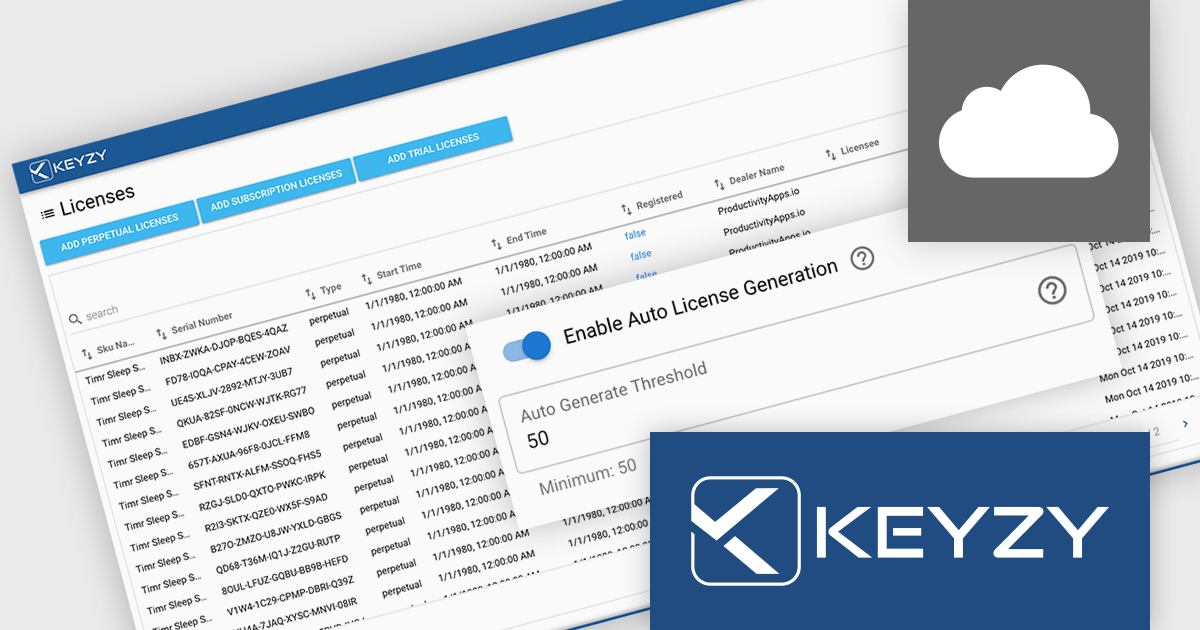
KEYZY is a cloud‑based software licensing manager that lets developers generate, deliver, track and manage licenses for their applications without hosting their own servers. It supports multiple licensing models (such as perpetual and subscription), provides a dashboard and APIs for organizing products, SKUs and dealers, and includes client libraries for integrating license activation and validation into software. The service runs on remote servers so vendors don’t have to maintain infrastructure, and it handles license distribution and enforcement for both online and offline use cases.
The KEYZY March 2026 release adds new Auto-Refill capability to the dashboard to help maintain consistent license availability. When the number of unused licenses for a SKU falls below 50, the system automatically generates and adds 100 new licenses to the pool. This helps avoid interruptions caused by depleted stock and supports uninterrupted sales activity without requiring manual intervention from administrators.
To see a full list of what's new in the March 2026 release, see our release notes.
KEYZY is licensed annually, with a renewal required each year to maintain access. It offers three subscription tiers - Single, Studio, and Business - each providing different limits on products, SKUs, dealers, and license counts to suit varying business needs. See our KEYZY licensing page for full details.
For more information, see our KEYZY product page.
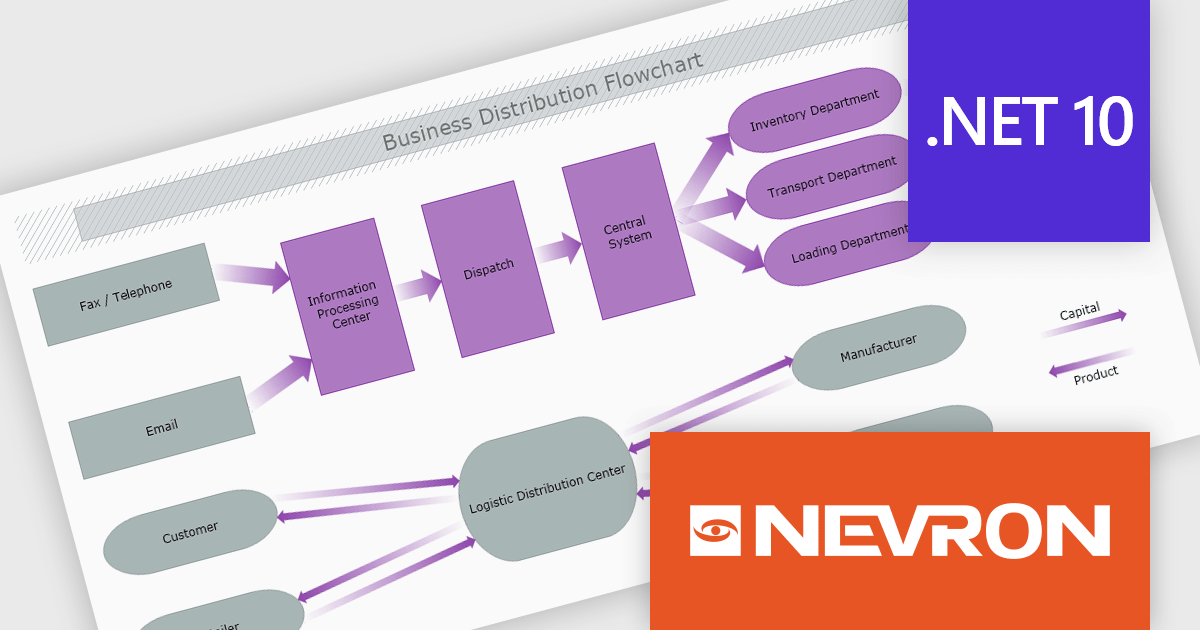
The Nevron .NET development components provide a comprehensive suite of components designed to help developers build advanced data presentation and visualization applications. It includes Nevron Chart for .NET, Nevron Diagram for .NET and Nevron User Interface for .NET, delivering tools for integrating charts, diagrams and rich user interface elements into Windows Forms and ASP.NET applications. With a well-structured object model, extensive features and flexible customization options, the suite enables developers to create applications that effectively visualize complex business, scientific or financial data while supporting interactive diagrams, automatic layouts and high-quality visual presentation.
The Nevron .NET product range now supports .NET Core 10.0 for its WinForms and WPF controls, enabling developers to build and maintain desktop applications using the latest .NET platform. Developers can take advantage of ongoing performance, security, and runtime enhancements in newer .NET versions without changing their UI component libraries, helping improve upgrades and maintain long-term platform alignment.
The Nevron .NET product range is licensed per developer machine and is available as a perpetual license with 1 year subscription and support. See our Nevron Vision for .NET licensing page for full details.
Support for .NET 10 is available across the Nevron .NET product range:
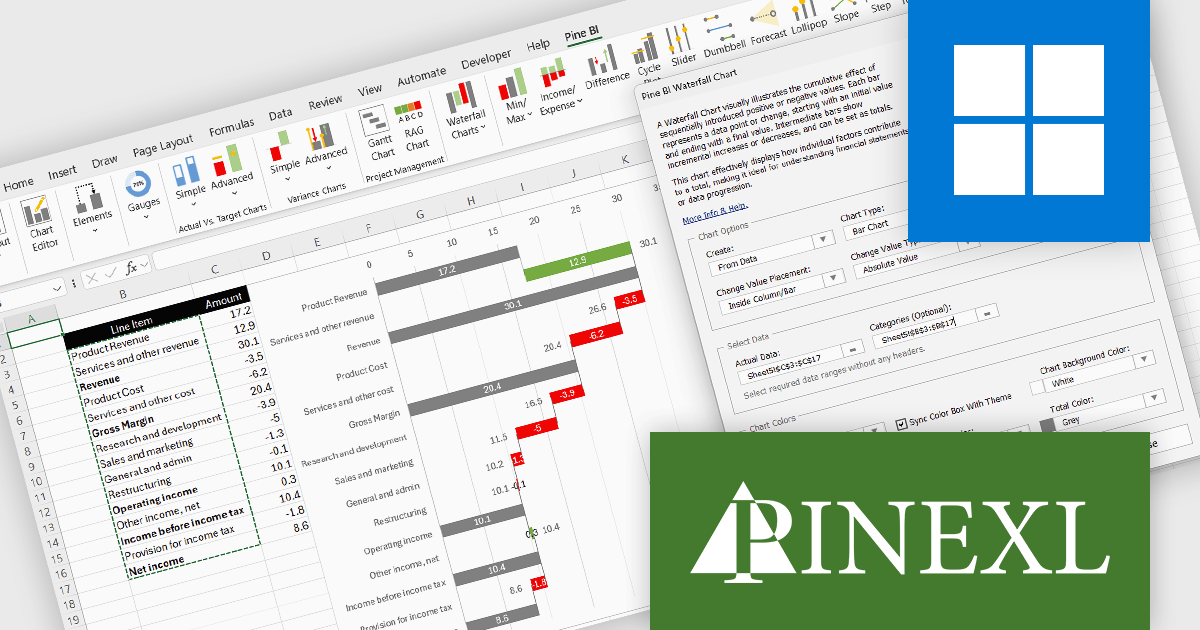
The Pine BI Excel Add-In facilitates the rapid generation of sophisticated and interactive Excel charts, enabling the transformation of standard workbooks into engaging dashboards that improve data visualization. These easily shareable visuals can also be integrated into Microsoft Word and PowerPoint, improving the creation of impactful reports and presentations across various business applications.
The Pine BI Excel Add-In v2.1 update improves waterfall chart functionality by introducing rebuilt formulas that support a cleaner and more consistent data structure. Instead of relying on automatically calculated totals that required blank fields, developers can now explicitly define which values act as totals within the dataset. This approach simplifies data preparation, removes the need for automatic final totals, and makes chart calculations more transparent and predictable. As a result, developers can create and maintain waterfall visualizations more efficiently, particularly when working with complex financial or analytical models.
To see a full list of what's new in v2.1, see our release notes.
Pine BI Excel Add-In is licensed annually on a subscription basis with 1, 5, and 10 seat options, requiring renewal for continued use and covering each concurrent computer, with the ability to transfer individual seat activation's as needed. See our Pine BI Excel Add-In licensing page for full details.
For more information, explore the Pine BI Excel Add-In product range.
ComponentSource and JSONBuddy have collaborated over the past year to provide developers with powerful tools for working with structured data. JSONBuddy specializes in advanced JSON editing, validation, and conversion solutions for Windows, offering multiple editions designed to handle everything from everyday development tasks to extremely large datasets.
At the centre of this partnership is JSONBuddy, a flagship JSON editor and validator, which ComponentSource offers to customers worldwide. With its Text, Grid, and Schema views, intelligent auto-completion, streaming validation engine, and JSON, CSV, and XML conversion, it delivers a comprehensive solution for efficient data management.
By adding JSONBuddy to its extensive software catalog, ComponentSource further differentiates its product offering with a best-in-class JSON development tool that complements other data, API, and developer solutions. Through ComponentSource’s global ecommerce platform, licensing expertise, and multilingual customer support, JSONBuddy’s products are delivered efficiently to development teams around the world.
Learn more about JSONBuddy.


Tel.: (888) 850 9911
Fax: +1 770 250 6199


