


Offizieller Lieferant
Als offizieller und autorisierter Distributor beliefern wir Sie mit legitimen Lizenzen direkt von mehr als 200 Softwareherstellern.
Sehen Sie alle unsere Marken.
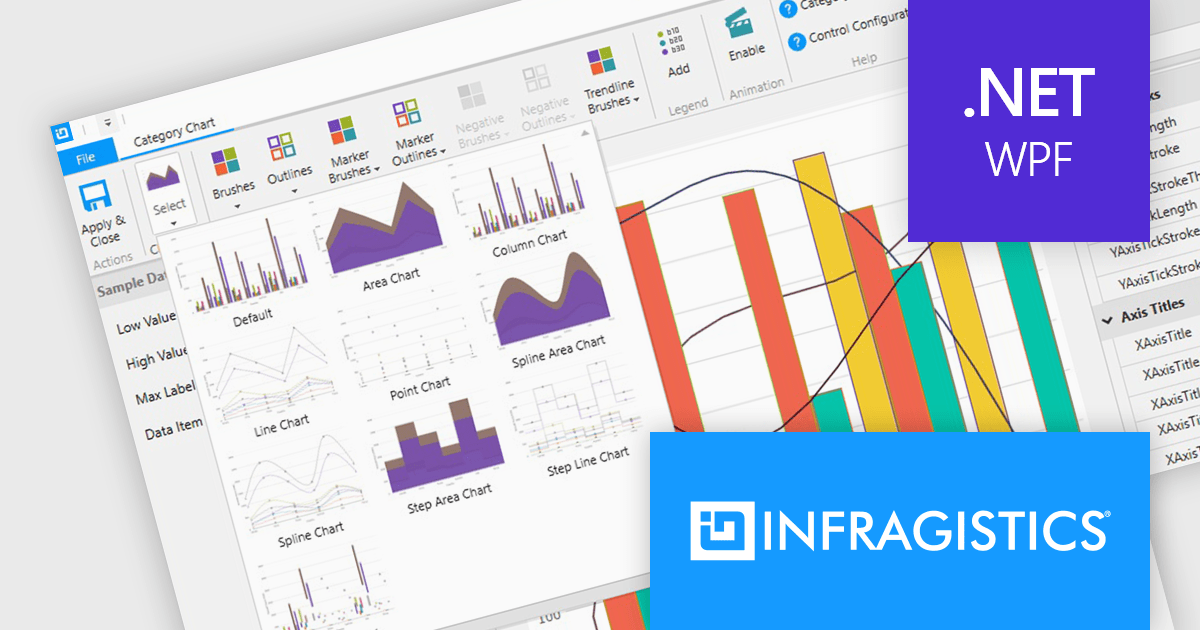
Infragistics Professional includes 100+ beautifully styled, high-performance grids, charts, & other UI controls, plus time-saving productivity tools for developers. In addition to controls for Angular, React, jQuery, Web Components, Blazor, ASP.NET MVC, ASP.NET Core, Windows Forms, and Xamarin, it also includes the powerful Infragistics Ultimate UI for WPF which encompasses a wide range of fast, touch-friendly WPF controls designed to help you bring modern, engaging apps for desktop and touch-screen devices.
Infragistics Professional empowers you to create informative and visually appealing data visualizations within your WPF applications. Its chart component library offers a vast selection of chart types, from bar and line charts to pie and scatter charts, ensuring you can effectively communicate your data insights. This functionality goes beyond aesthetics, featuring intelligent data binding, customizable styles, and interactive elements like callouts and crosshair lines for a truly comprehensive charting experience.
Infragistics Professional is licensed per developer and is available as a Perpetual License with a 1, 2 or 3 year support and maintenance subscription. See our Infragistics Professional licensing page for full details.
The Infragistics WPF Chart Components are available in the following products:
We are pleased to announce the publication of issue #115 of the ComponentSource Showcase Catalog. The latest edition includes a selection of components and tools designed to meet the needs of software developers and IT professionals.
Over the last 28 years, ComponentSource has built a comprehensive marketplace to help its users discover, compare and buy Enterprise-grade software components and tools. The ComponentSource Catalog showcases a range of products in an easy-to-digest print publication.
Issue #115 features an assortment of components and tools from market leading publishers including:
Products include file format APIs, reporting solutions, user interface controls for .NET and JavaScript, communications components, and much more.
Available in English, German, Korean and Japanese editions, the 52-page full color publication lets you easily browse selected products and read about highlighted features. If you want more information, the QR codes on each page (and links in the PDF version) take you directly to that product's page on the ComponentSource website.
You can browse the latest issue online or visit the ComponentSource Showcase Catalog page to download a PDF.
To receive your FREE physical copy of future issues (available in Europe, US, Canada, Japan and South Korea), simply follow these steps:
We'll deliver a new issue direct to your door four times per year.
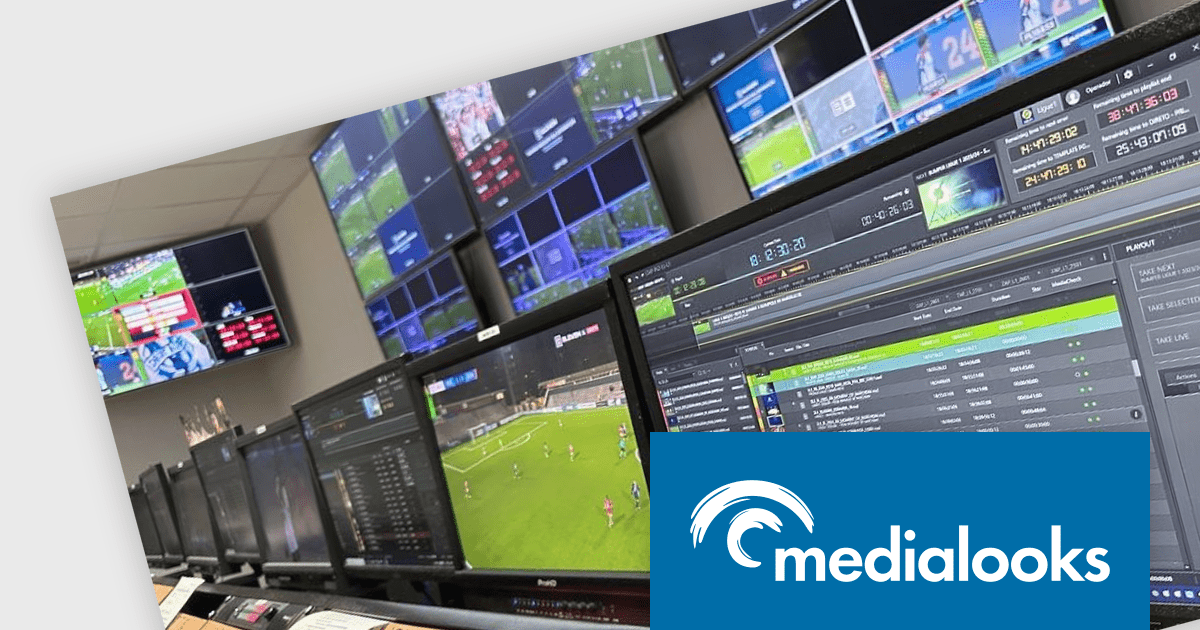
MPlatform SDK by Medialooks is a professional multimedia software development kit with native support for C#, VB.NET, VB6, Visual C++ and Delphi. MPlatform includes direct integration with hardware I/O from AJA, BlueFish444, Blackmagic Design, Deltacast & Stream Labs. MPlatform makes it easy to create broadcast-quality live streaming, ingest, vision mixing and playout automation software.
This case study features Daniel Gonçalves, Innovation Officer at wTVision, a company that builds powerful integrated broadcast solutions for TV stations worldwide. In it, he discusses how the company built wTVision Media Server Streaming Edition, a 100% software-based video playout solution. Utilizing the Medialooks SDK enabled wTVision to quickly replace the video management core of their software enabled the company to save time and deliver more of the comprehensive features that the broadcast business requires.
Read the full Medialooks blog post to see how wTVision leveraged MPlatform SDK to accomplish this impressive task.
MPlatform SDK is licensed per company - with support for up to 4 developers - and is available as a perpetual license with annual subscription. See our MPlatform SDK licensing page for full details.
For more information, visit our MPlatform SDK product page.
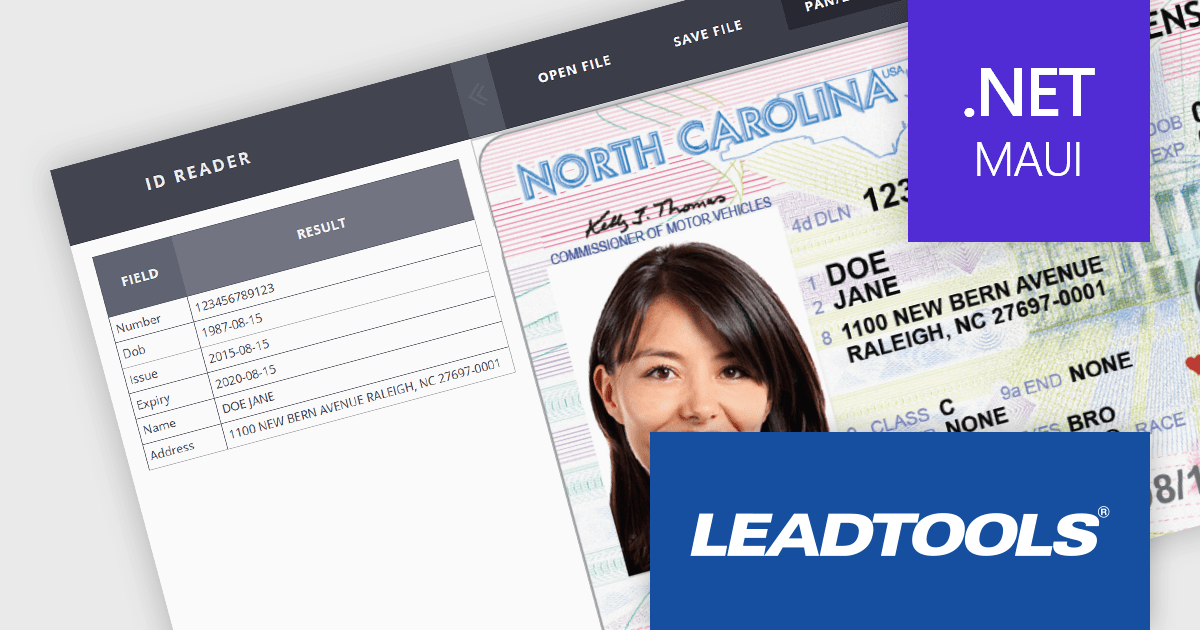
LEADTOOLS Recognition SDK is a software development toolkit designed for building applications that extract data from images and documents. It empowers developers with features like Optical Character Recognition (OCR) for converting scanned documents to text, barcode reading, and form processing. Additionally, it offers functionalities for handling various file formats, image pre-processing, and document viewing, making it a comprehensive solution for automating document workflows in enterprises and organizations.
LEADTOOLS v23 allows developers to build cross-platform apps with advanced features using .NET MAUI. LEADTOOLS .NET Standard libraries seamlessly integrate with the .NET MAUI app model for building Android, iOS, and UWP applications. This simplifies development by providing ready-made components like OCR, barcode recognition, PDF handling, document viewers, and more. LEADTOOLS functionalities include image processing, annotations, compression, and various file formats, all within the familiar .NET MAUI environment.
To see a full list of what's new in v23, see our release notes.
LEADTOOLS Recognition SDK is licensed as Development Licenses, for developers to use the SDKs, and Deployment Licenses, for the right to distribute end user solutions. See our LEADTOOLS Recognition SDK licensing page for full details.
Learn more on our LEADTOOLS Recognition SDK product page.
Saving PDFs to a stream offers increased flexibility and efficiency in the management and transmission of PDF documents. This approach of saving PDF files segments the file's content into an organized and compressed sequence of bytes (the stream), representing the content and structure of the document. This method allows for faster initial loading by prioritizing text content, enables partial downloads for quicker access over slow connections, and reduces memory usage by loading only the currently viewed section. This allows for real-time processing, manipulation, and direct transmission of data without the intermediary step of storing it on a disk. Employing streams is particularly advantageous in scenarios requiring memory efficiency, dynamic content generation, seamless network distribution, or integration within larger systems where direct file handling is cumbersome or inefficient.
Several .NET 8 PDF components allow you to save PDFs to a stream, including:
For an in-depth analysis of features and price, visit our comparison of .NET 8 PDF components.


Tel.: (888) 850 9911
Fax: +1 770 250 6199


