


Offizieller Lieferant
Als offizieller und autorisierter Distributor beliefern wir Sie mit legitimen Lizenzen direkt von mehr als 200 Softwareherstellern.
Sehen Sie alle unsere Marken.
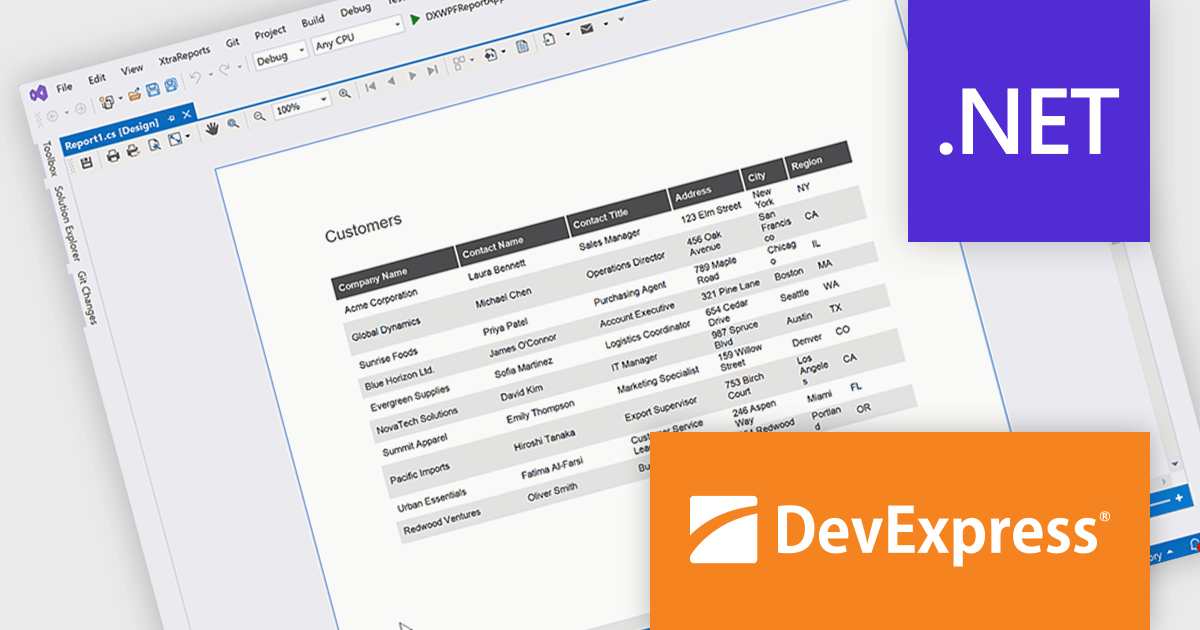
DevExpress Reporting is a comprehensive suite of reporting tools that empowers developers to create visually stunning and highly customizable reports for various applications. With its rich feature set, including data binding, layout design, printing, and exporting capabilities, DevExpress Reporting enables the efficient creation of reports that meet the most demanding business requirements.
The DevExpress Reporting 25.2 update allows developers to generate AI-generated test data to preview reports directly within the Visual Studio and End-User Report Designers for WinForms and WPF. By removing the need to connect to a live data source during design, it supports faster iteration and easier layout validation. This is particularly valuable when production data is unavailable or when sharing report templates that must not include sensitive information.
To see a full list of what's new in version 25.2, see our release notes.
DevExpress Reporting is licensed per developer and is available as a Perpetual License with a 12 month support and maintenance subscription. See our DevExpress Reporting licensing page for full details.
DevExpress Reporting is available to buy in the following products:
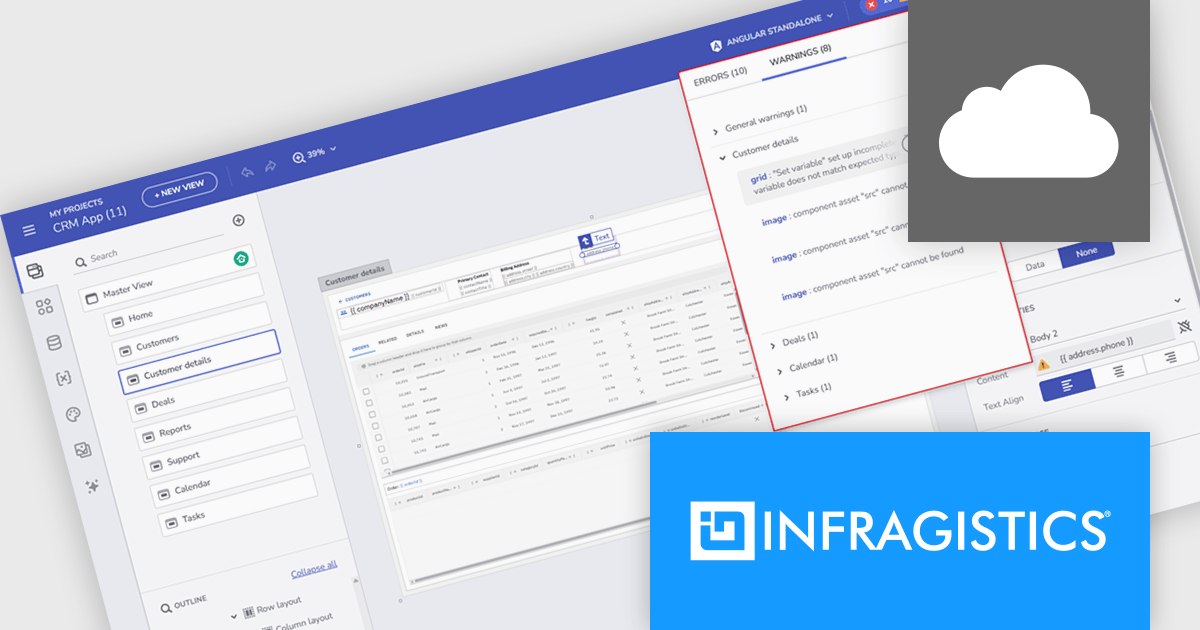
Infragistics App Builder is a cloud-based, WYSIWYG development tool that improves enterprise application creation through drag-and-drop functionality. Designed to accelerate development lifecycles, it helps developers to build business apps more quickly with features like prebuilt templates, real-time code generation, and instant previews. This low-code approach is ideal for businesses seeking to improve development efficiency and shorten time-to-market for web applications.
The new App Builder release includes a centralized design-time notifications panel that improves how developers identify and resolve issues during UI composition. This dedicated interface consolidates all errors and warnings - such as broken bindings, missing resources, and invalid parameters - into a single, easy-to-navigate view. By surfacing these problems early, and providing direct links to the affected components, the feature helps prevent code generation failures and runtime exceptions. It’s a practical step forward for anyone aiming to maintain clean, functional designs while accelerating front-end development.
To see a full list of what's new, see our release notes.
Infragistics App Builder is licensed per developer as an annual subscription. See our Infragistics App Builder licensing page for full details.
Infragistics App Builder is available individually or as part of Infragistics Ultimate.
ComponentSource and Aqua Data Studio have worked closely together for the past year to support developers, database administrators, and data professionals with powerful tools for managing and working with data. Aqua Data Studio’s products are designed to simplify database development and administration, supporting a wide range of relational and NoSQL databases through intuitive, productivity-focused solutions.
Central to this collaboration is their product Aqua Data Studio, a flagship database IDE, which is offered to customers worldwide. By bringing together query development, database design, data visualization, and version control in a single platform, Aqua Data Studio helps teams work more efficiently across complex database environments.
This partnership enables ComponentSource to further differentiate its product offering by delivering a best-in-class database management solution alongside its global licensing, procurement, and customer support expertise. By working with Aqua Data Studio, ComponentSource helps ensure that Aqua Data Studio’s tools reach a worldwide audience, while customers benefit from a trusted purchasing experience and access to leading data development technology.
Learn more about Aqua Data Studio.
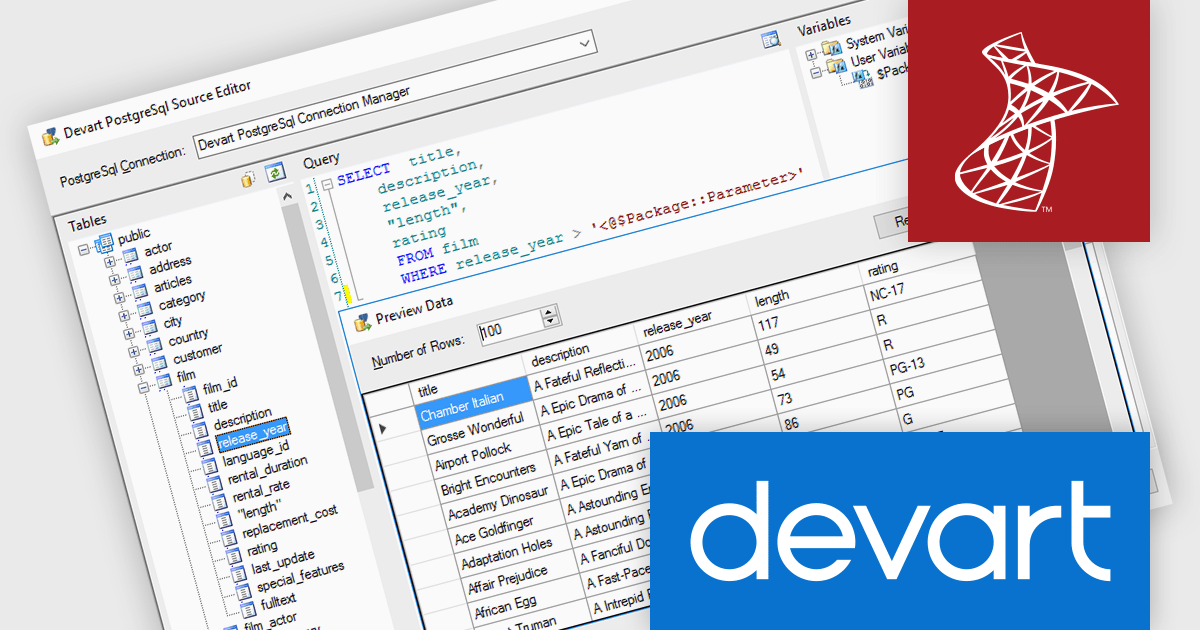
Devart SSIS Data Flow Components for PostgreSQL provide an optimized solution for integrating PostgreSQL databases with Microsoft SQL Server. These components enable efficient data extraction, transformation, and loading (ETL) processes, allowing developers to connect to PostgreSQL databases effortlessly within SSIS workflows. With support for advanced data mapping, bulk operations, and bidirectional synchronization, the tool simplifies complex data integration tasks while maintaining high performance and reliability.
Devart SSIS Data Flow Components for PostgreSQL adds support for PostgreSQL 18, enabling organizations to leverage the latest advancements of PostgreSQL directly within SSIS processes. PostgreSQL 18 introduces major improvements such as a redesigned asynchronous I/O subsystem that can dramatically accelerate data reads and query performance, enhanced SQL features like virtual generated columns and UUIDv7 support, and simplified upgrade processes that preserve important planner statistics.
Devart SSIS Data Flow Components for PostgreSQL is licensed per developer or per server and is available as an Annual or Perpetual License with a 12 month support and maintenance subscription. See our Devart SSIS Data Flow Components for PostgreSQL licensing page for full details.
Devart SSIS Data Flow Components for PostgreSQL is available individually or as part of Devart SSIS Universal Bundle.
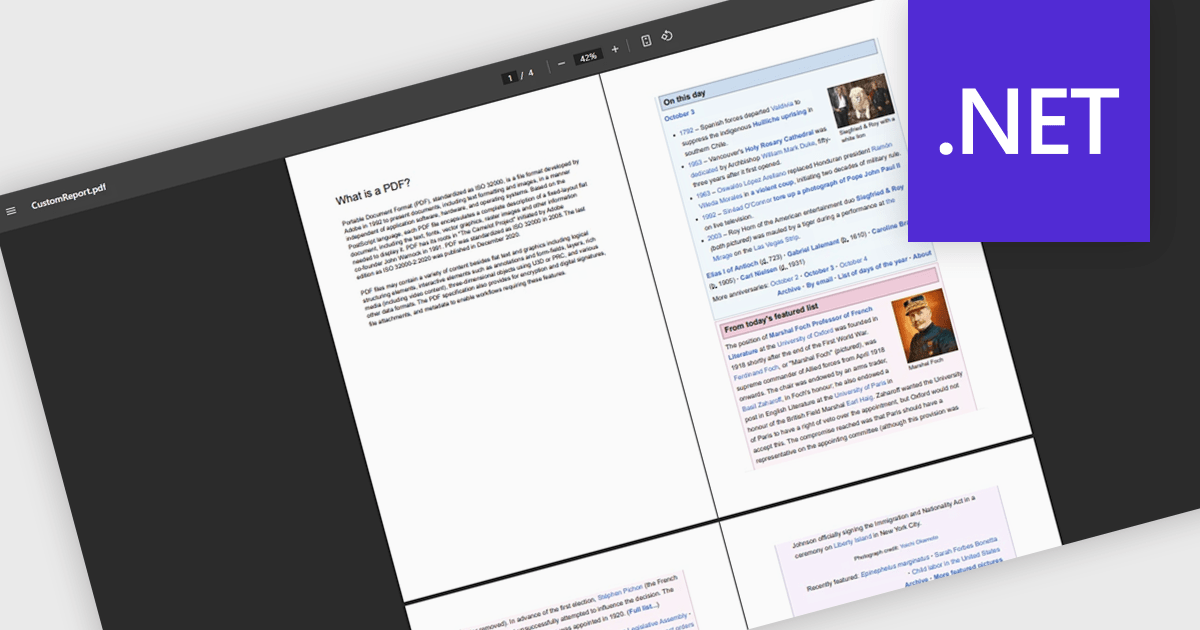
Merging PDFs in a PDF viewer allows users to combine multiple PDF files into a single, unified document directly within the viewing application, without the need for external tools. This capability improves document management by preserving original formatting, page order, and visual consistency while reducing file clutter and simplifying sharing. By consolidating related content into one professional-looking file, users can improve collaboration, ensure clearer communication, and save time otherwise spent managing multiple attachments. Common use cases include compiling reports from multiple contributors, combining invoices or statements for record-keeping, assembling project documentation, or preparing complete proposals and presentations for clients and stakeholders.
Several .NET PDF viewer components offer PDF merging support including:
For an in-depth analysis of features and price, visit our .NET PDF viewer comparison.


Tel.: (888) 850 9911
Fax: +1 770 250 6199


