Stimulsoft BI Designer 2020.3.1

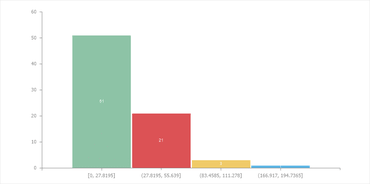
Integriert ein neues Histogrammdiagramm.
Juni 15, 2020
Neue Version

Funktionen

  • Added new properties: Axis.StartFromZero, Axis.ShowEdgeValues and Axis.Range.
  • Added ShowNulls and ShowZeros properties to Chart element.
  • Added simplified Chart editor.
  • Added MinimumColor and MaximumColor properties to Table element.
  • Added new system variables: Line, LineABC and LineRoman.
  • Added new Constant Lines editor in Chart component.
  • Added new Position property to ConstantLine of Chart element.
  • Added Histogram chart.
  • Added new Labels property editor.
  • Improved default size in text element editor.
  • Expressions can now be used in the ConstantLines.AxisValue property of Chart component.
  • Expressions can now be used in the Strips.MinValue, Strips.MaxValue and Strips.Text properties of Chart component.
  • Improved loading images from a URL at design time in the report designer.
  • Improved Advanced Chart editor.
  • Redesigned Constant Lines editor in Chart element.
  • Improved Strips Editor.
  • Improves UI localizations order.
  • Improved tooltips in Gantt charts.
Histogram chart.

Stimulsoft Designer

Erstellen, Bearbeiten und Anzeigen von Berichten und Dashboards.

Stimulsoft Designer ist auch verfügbar in:

Sie haben eine Frage?

Live-Chat mit unseren Stimulsoft-Lizenzierungs-Spezialisten.