Chart TypesChoose from over 20 different chart types including Area, Bar, Bubble, Financial, Line, Pie, Radar-Polar, Scatter, Statistical, Surface & Contour.

Visual AttributesCustomizable legends, ready-to-use color palettes, multiple and customizable axes, annotation objects, per-marker attributes, gridlines, background images and border objects, Chart FX for .NET allows you to create some of the most visually appealing charts in just minutes.

Multiple X AxisSupports unlimited X axes.

Multiple Y AxisSupports unlimited Y axes.

Data Analysis - Axis SectionsApply specific labels, fonts, colors, grids and backgrounds to particular sections of your axes.

Data EditorEasily customize the Chart FX for .NET Data Editor to fit with the style of your charts. The new Data Editor was improved to not only be functional, but fashionable

AnnotationsAnnotations, such as polygonal objects, arrows, images and text, can be added to a chart.

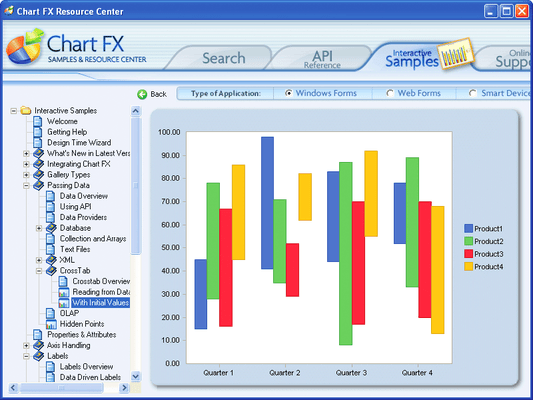
Population Methods - Cross TabPopulation methods include, API, DataSet Binding, XML, Collections, Arrays, Text Files, Crosstab, ADOMD (OLAP) and XML for Analysis (OLAP).

TitlesSupports multiple texts for the chart and each axis. Each title can have its own font and color, for an enhanced look

Customizable LegendsSeries and/or points legends can be shown in different positions: stacked (customizable, left, top, right, bottom, near, center, far, spread) or floating anywhere in the chart.

LabelsShow the value of each marker. Font, color, position and angle can be changed universally or individually for each marker.

XMLImport and export data in XML format.

ToolbarsIntuitive buttons serve as shortcuts for the most used features by the end-users. The toolbar can be customized to meet specific needs.
![]()
![]()
![]()
![]()
![]() (1)
(1)


