Über Infragistics Ignite UI for React

Leistungsstarke Datenraster und Datendiagramme mit hohem Volumen.

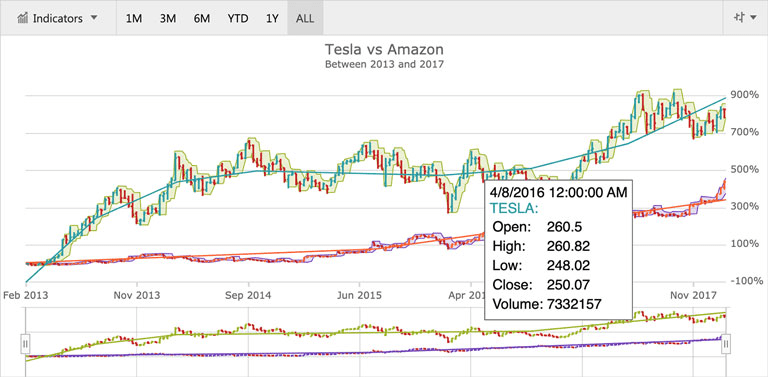
Infragistics Ignite UI for React includes a lightweight React data grid and real-time, high-volume data charts The lightweight data grid was built to meet the challenge of displaying large amounts of data while providing superior versatility and performance on mobile devices. The data charts help you build expressive dashboards, apply deep analytics, and render millions of data points in real-time React charts.

Infragistics Ignite UI for React includes the following components:

Charts

  • Data Chart
  • Financial Chart
  • Category Chart
  • Pie Chart
  • Doughnut Chart
  • Sparkline

Layout

  • Dock Manager

Editors

  • Multi-Column Combo Box
  • Date Picker

Grids and Lists

  • Cell Editing
  • Data Grid
  • Spreadsheet

FrameWorks

  • Excel Library

Maps

  • Map

Data Visualizations

  • Tree Map
  • Zoom Slider

Gauges

  • Bullet Graph
  • Linear Gauge
  • Radial Gauge