


Fornitore ufficiale
In qualità di distributori ufficiali e autorizzati, forniamo licenze software legittime direttamente da più di 200 autori di software.
Vedi tutte le nostre marche
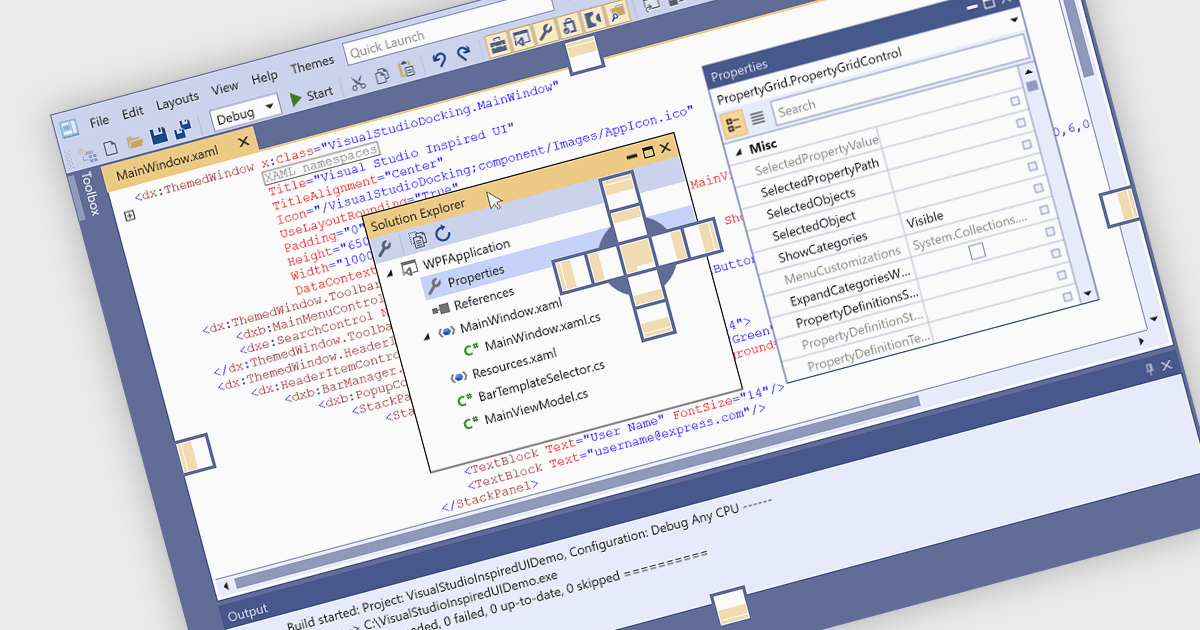
Docking controls are a key element of user interface design that enhance the usability of complex applications. They allow users to rearrange windows or panels within the main application window, making it easier to create personalized, efficient layouts. These controls typically support drag-and-drop interactions and automatic alignment, which help users maintain a tidy and organized workspace while working with multiple tools or data views. Docking frameworks often include features like tabbed documents, floating windows, and layout persistence, all of which contribute to a more flexible and user-driven application environment. This makes docking especially useful in professional software environments that involve large volumes of information or tool-based workflows.
Several WPF UI suites provide you with docking support, including:
For an in-depth analysis of features and price, visit our comparison of WPF UI suites.
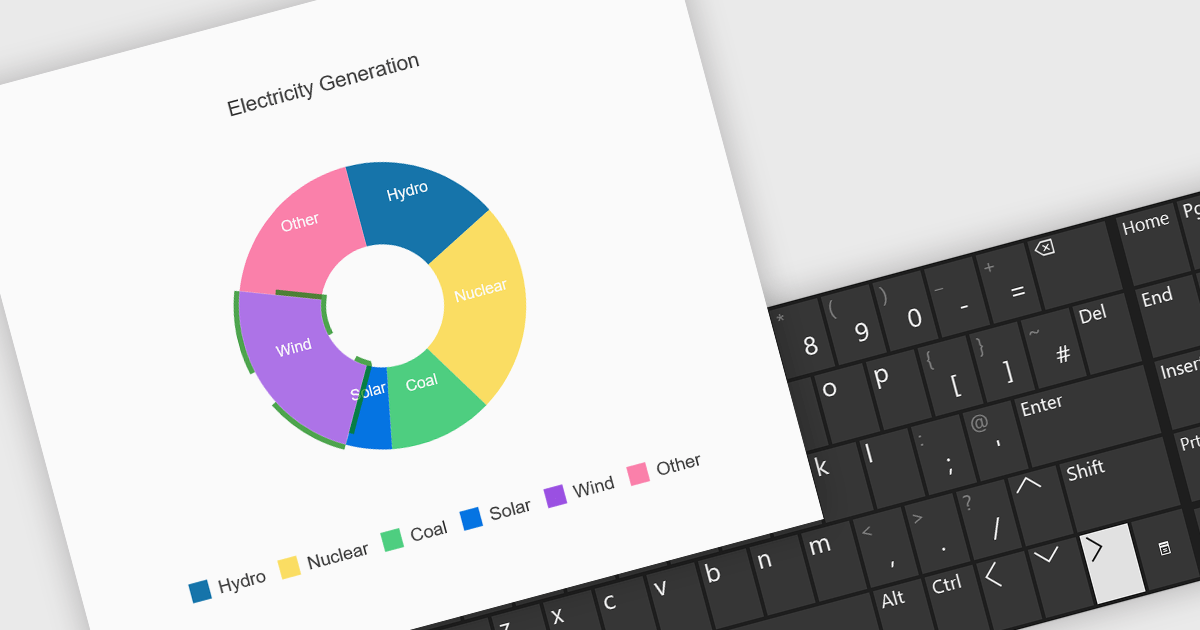
Charts with keyboard navigation support are designed to improve accessibility and usability by allowing users to explore chart data using only the keyboard. This feature is especially valuable for users who rely on assistive technologies or prefer keyboard interaction over a mouse. It typically includes capabilities like navigating between data points, series, or chart elements using arrow keys, accessing tooltips or data labels, and sometimes triggering events like selection or focus changes, all through the keyboard.
Several .NET chart components support keyboard navigation, including:
For an in-depth analysis of features and price, visit our comparison of .NET chart components.
Telerik UI for ASP.NET Core, MVC, and Blazor are component libraries for building modern web apps with .NET. Each provides a rich set of customizable UI elements, like grids, charts, and forms, tailored to its respective framework, helping developers create responsive, interactive, and accessible user interfaces.
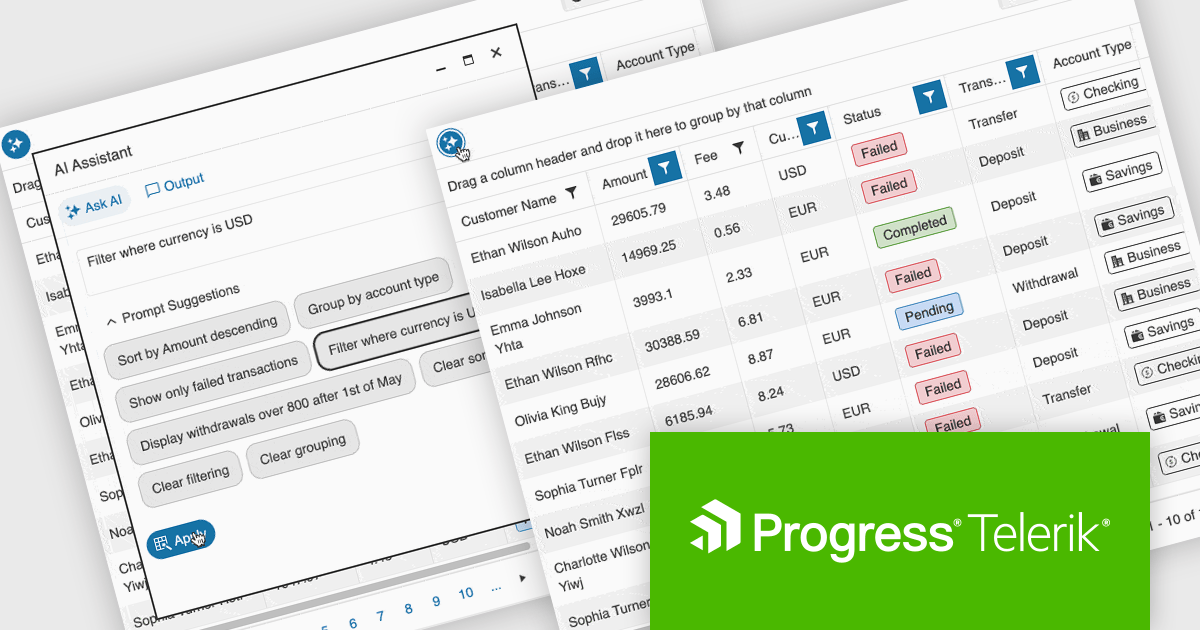
The latest update to the Telerik UI DataGrid introduces AI-driven controls that respond to natural-language prompts, making it easier for users to work with complex datasets. Users can now reorder, resize, and toggle column visibility just by describing what they want. Pagination, row selection, and data export to Excel, PDF, or CSV formats can also be handled through conversational input, reducing clicks and improving accessibility for both technical and non-technical users.
Telerik UI for ASP.NET Core, UI for MVC, and UI for Blazor are all licensed per developer and have two licensing models: an annual Subscription License and a Perpetual License. The Subscription License must be renewed to continue using the software. The Perpetual license is a one-time purchase granting access to the current released version and includes a one-year subscription for product updates and technical support. See our Telerik UI for ASP.NET Core, Telerik UI for ASP.NET MVC or Telerik UI for Blazor licensing pages for full details.
Telerik UI for ASP.NET Core, Telerik UI for ASP.NET MVC and Telerik UI for Blazor are available to buy individually or as part of the following products:
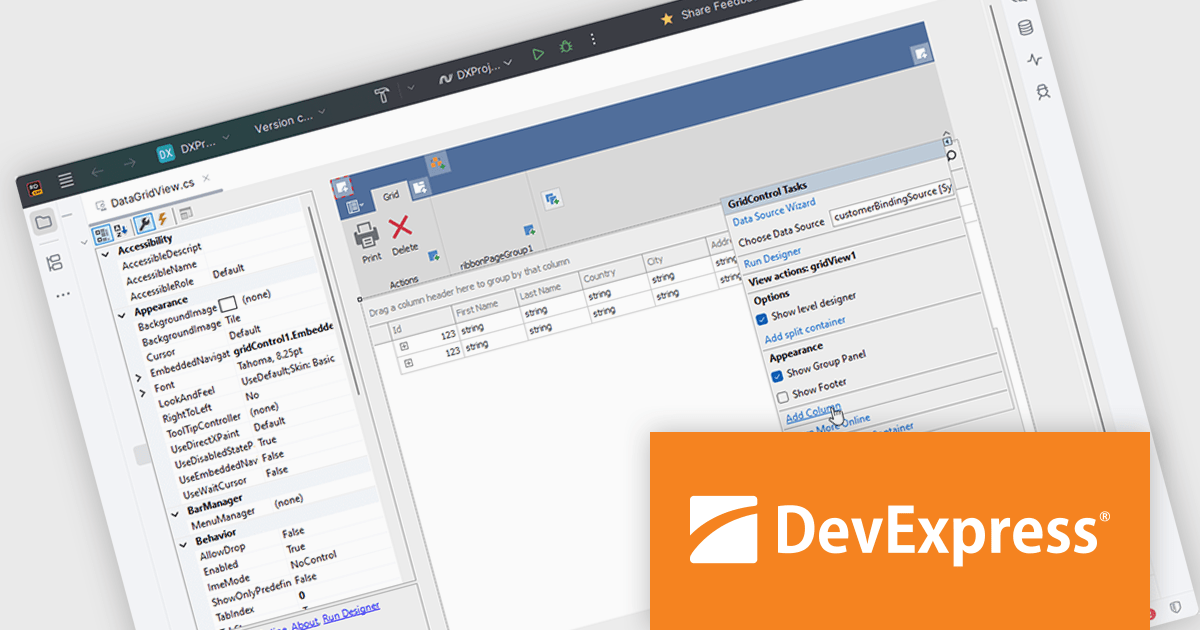
DevExpress DXperience is a comprehensive set of UI controls and developer productivity tools for building data-driven desktop and web applications using technologies such as WinForms, WPF, ASP.NET, Blazor and JavaScript, focusing on consistent user experiences, advanced data visualization, reporting, dashboards, and design-time features that support the development and long-term maintenance of complex business applications.
The DevExpress DXperience 25.2 release introduces JetBrains Rider support, allowing developers to visually configure and customize major DevExpress UI WinForms components directly within Rider’s designer environment. This integration brings familiar design-time experiences to teams using Rider, making it easier to adjust layouts, component properties, and UI behavior without leaving the IDE. By aligning DevExpress visual designers with Rider, the update supports faster iteration, clearer UI intent, and a more consistent development experience across tools.
DevExpress DXperience is licensed per developer and is available as a Perpetual License with a 12 month support and maintenance subscription. See our DevExpress DXperience licensing page for full details.
For more information, visit our DevExpress DXperience product page.
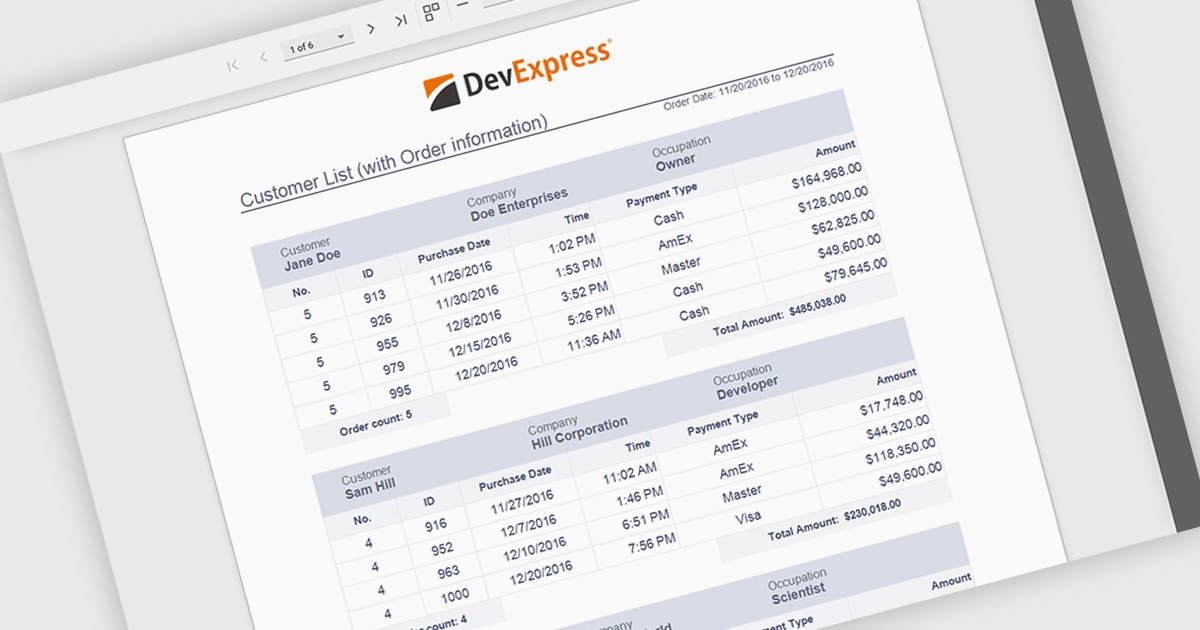
Subreports allow independently maintained reports to be embedded within a master report, enabling a modular and flexible reporting design. Each Subreport can be created, maintained, and reused separately, while connecting to the master report through parameters that dynamically filter its data from a separate data source. This approach simplifies complex reporting scenarios, improves consistency, and reduces maintenance effort by avoiding duplicated logic. Common use cases include displaying detailed line items within summary reports, combining data from multiple databases, or reusing standardized sections such as invoices, audit details, or customer histories across multiple reports.
Several ASP.NET Core reporting controls offer support for subreports including:
For an in-depth analysis of features and price, visit our ASP.NET Core reporting controls comparison.


Tel: (888) 850 9911
Fax: +1 770 250 6199


