


Fornitore ufficiale
In qualità di distributori ufficiali e autorizzati, forniamo licenze software legittime direttamente da più di 200 autori di software.
Vedi tutte le nostre marche
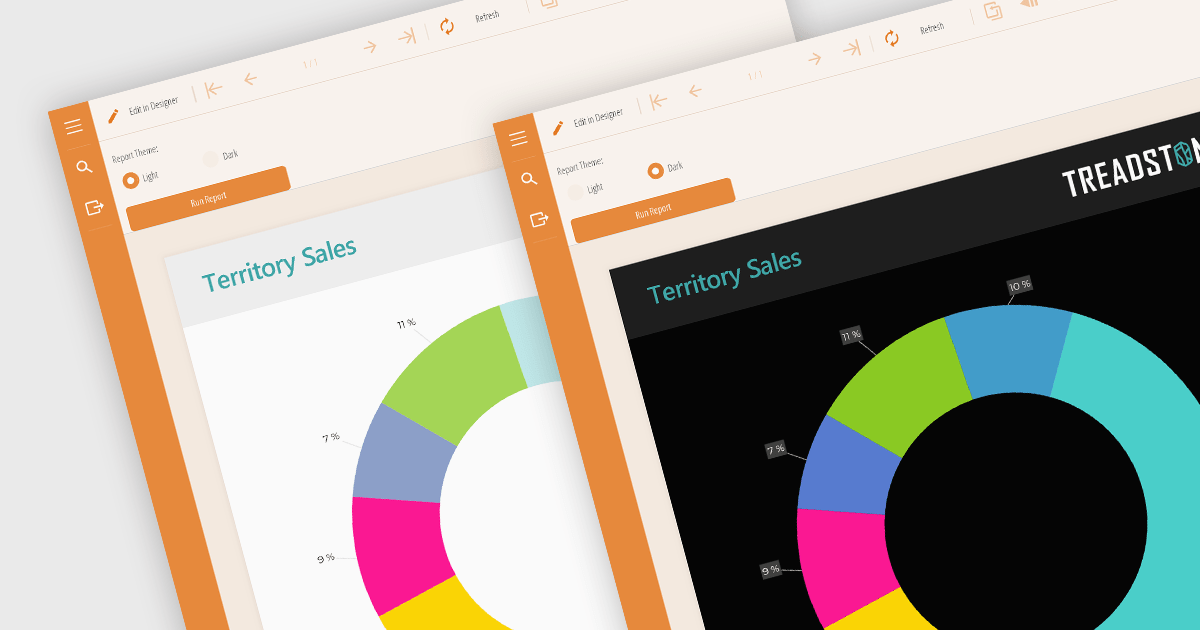
Reporting component themes provide a consistent visual style and branding across complex data visualizations. By offering pre-defined color palettes, typography, and layout options, themes streamline the design process and ensure reports align with overall application aesthetics. They enable rapid customization, allowing developers to create multiple themes for different report types or user preferences. Additionally, themes enhance user experience by improving readability and data perception, making complex information easier to understand. Use cases include creating branded reports, adapting to different screen sizes, and matching the look and feel of existing applications.
Several React reporting controls offer support for themes including:
For an in-depth analysis of features and price, visit our React reporting controls comparison.
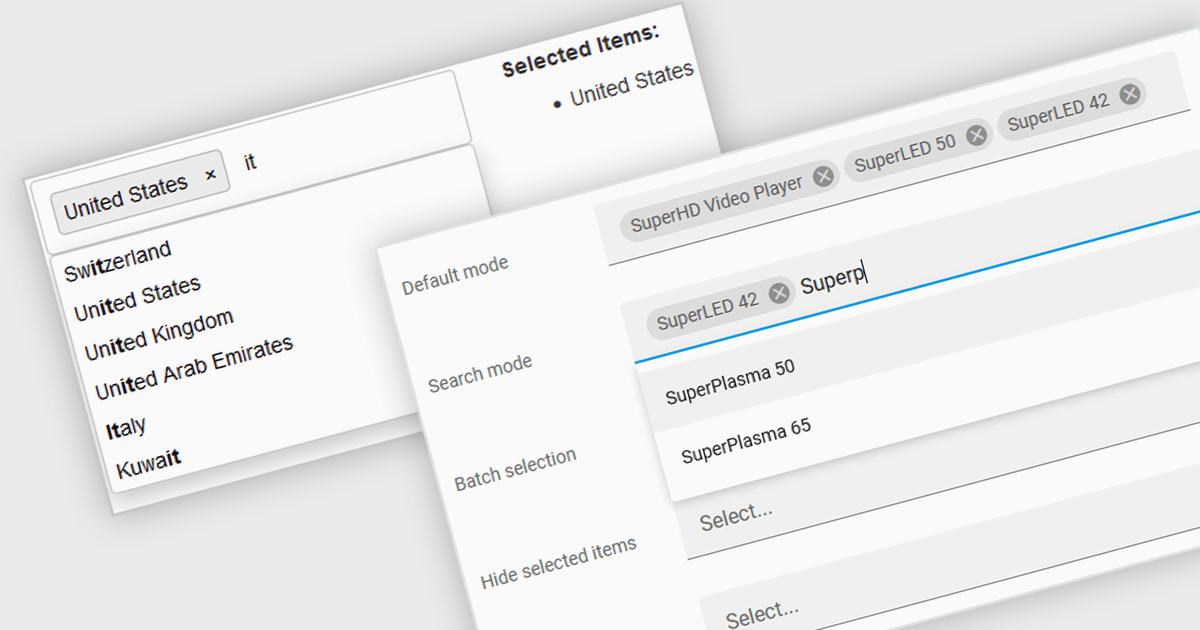
Token boxes, also known as token input controls, are user interface elements designed to streamline data entry for multiple values. They allow users to input, manage, and manipulate discrete pieces of data (tokens) within a single form field. This enhances user experience by facilitating tagging, categorization, and selection of multiple items, while providing developers with a robust tool for intuitive interfaces. The benefits include improved clarity through visual separation of values, efficient data handling, and ease of use in applications like search filters, email address inputs, and tagging systems.
Many React data editor collections contain token box / input controls including:
For an in-depth analysis of features and price, visit our comparison of React Data Editors.
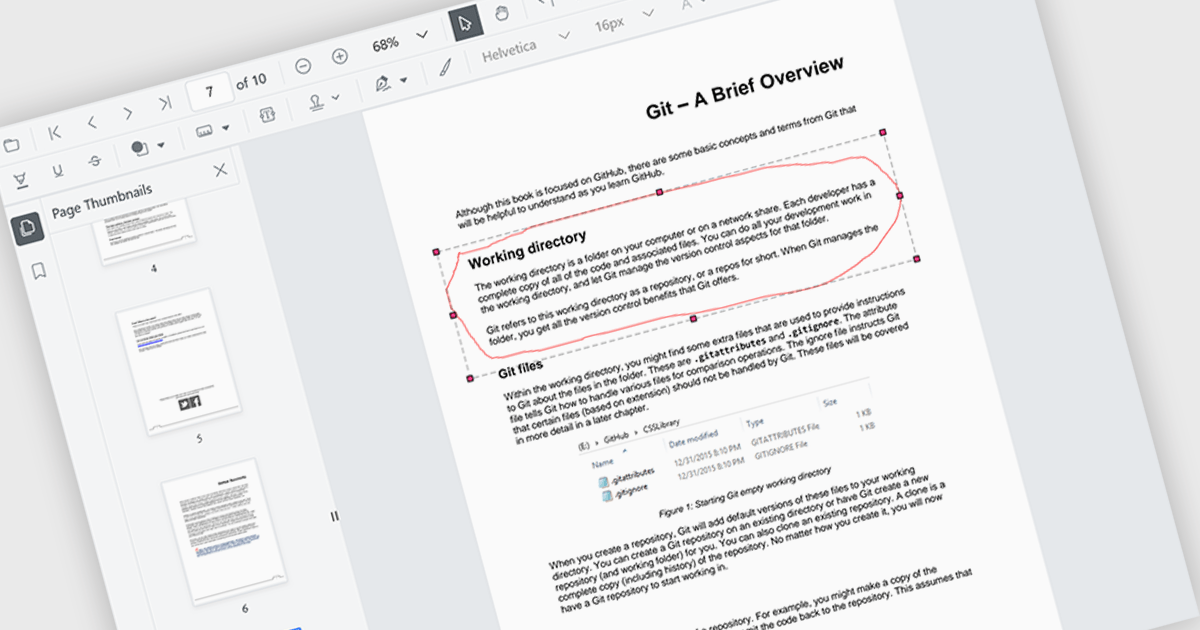
The ability to draw freehand annotations in PDF viewers allows users to directly mark up documents with digital ink, creating visual cues like circles, arrows, or custom shapes that can enhance communication and clarity. This is particularly useful for tasks like highlighting key passages, identifying areas for revision, or providing feedback in a more intuitive way compared to traditional text-based annotations.
Several React PDF viewer components offer the ability to draw freehand annotations including:
For an in-depth analysis of features and price, visit our React PDF viewer components comparison.
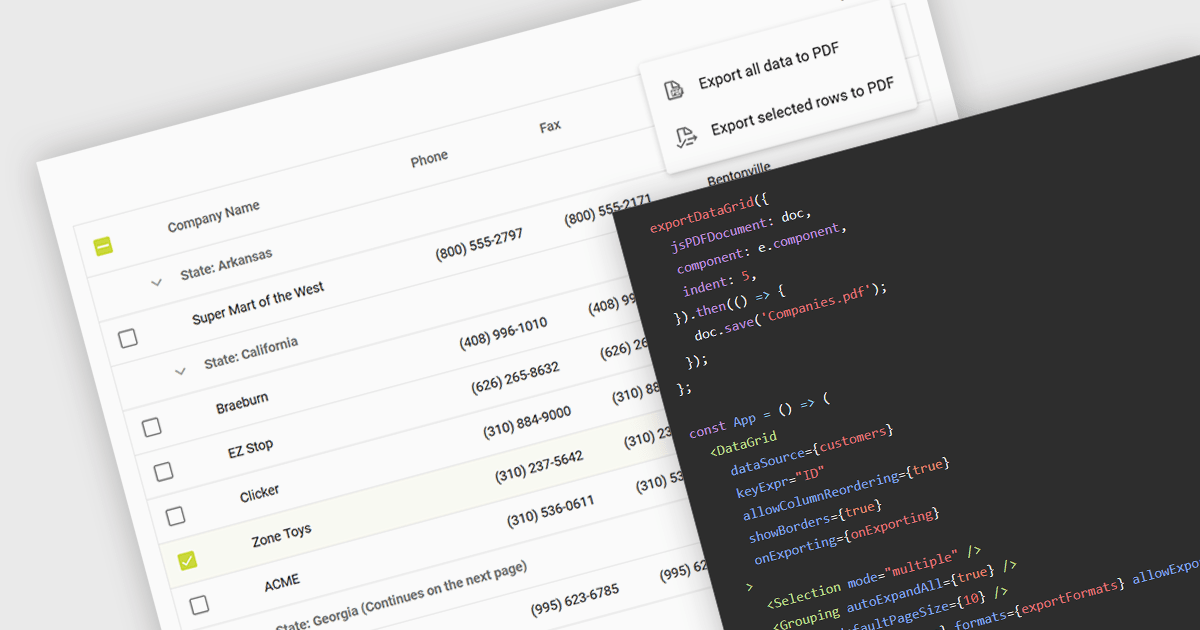
Exporting a data grid to PDF captures the grid layout, including columns, rows, and formatting, and transforms it into a universally accessible and easily shareable document. The export creates a static file, retaining the original grid layout and formatting, that can be easily distributed and viewed consistently across different platforms and on any device with a PDF reader. Additionally, PDFs provide a secure format for preserving data integrity and can be protected against unauthorized editing, making them ideal for official documentation and archiving purposes. This functionality enhances collaboration and data dissemination efficiency by simplifying the sharing and printing processes while maintaining the original data structure and presentation.
Several React grid components allow you to export to PDF, including:
For an in-depth analysis of features and price, visit our comparison of React grid components.
Wijmo by MESCIUS is a comprehensive JavaScript library offering a suite of high-performance UI components and data grids specifically designed to streamline the development of modern enterprise applications. It emphasizes reduced development time and improved maintainability, along with a focus on performance through its efficient design and small module size. Wijmo integrates seamlessly with popular JavaScript frameworks like Angular, React, and Vue.js, and supports cutting-edge technologies like TypeScript, making it a versatile solution for building complex web applications.
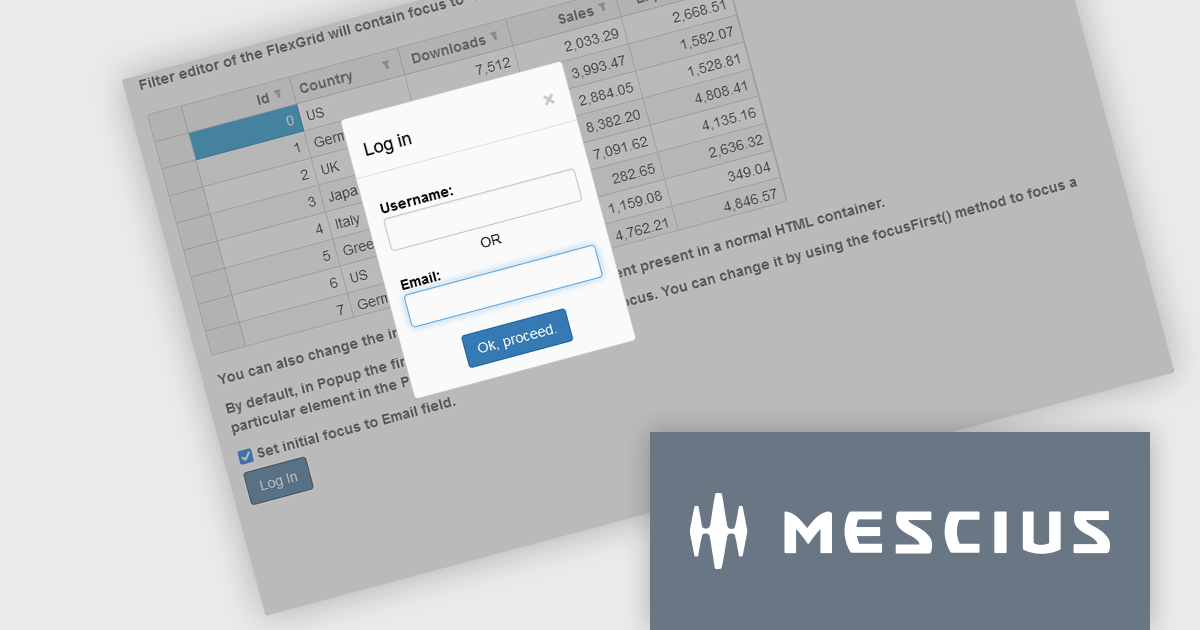
The Wijmo 2024 v1 (Build 5.20241.19) update introduces a new focusFirst Utility that allows developers to set which part of a component should get the initial focus. Setting the first interactive element upon loading a container control improves accessibility by ensuring a clear starting point for keyboard interaction. For example instead of the default focus point of a login dialog being the username field, the email address field could be set as the initial focus point.
To see a full list of what's new in 2024 v1 (Build 5.20241.19), see our release notes.
Wijmo is licensed per developer. Developer Licenses are perpetual and include 1 year Subscription which provides upgrades, including bug fixes and new features. See our Wijmo licensing page for full details.
Learn more on our Wijmo product page.


Tel: (888) 850 9911
Fax: +1 770 250 6199


