


공식 공급 업체
200 이상의 소프트웨어 개발처와 판매 계약을 맺은 공인 디스트리뷰터로서 합법적인 라이선스를 제공합니다.
모든 브랜드 보기.
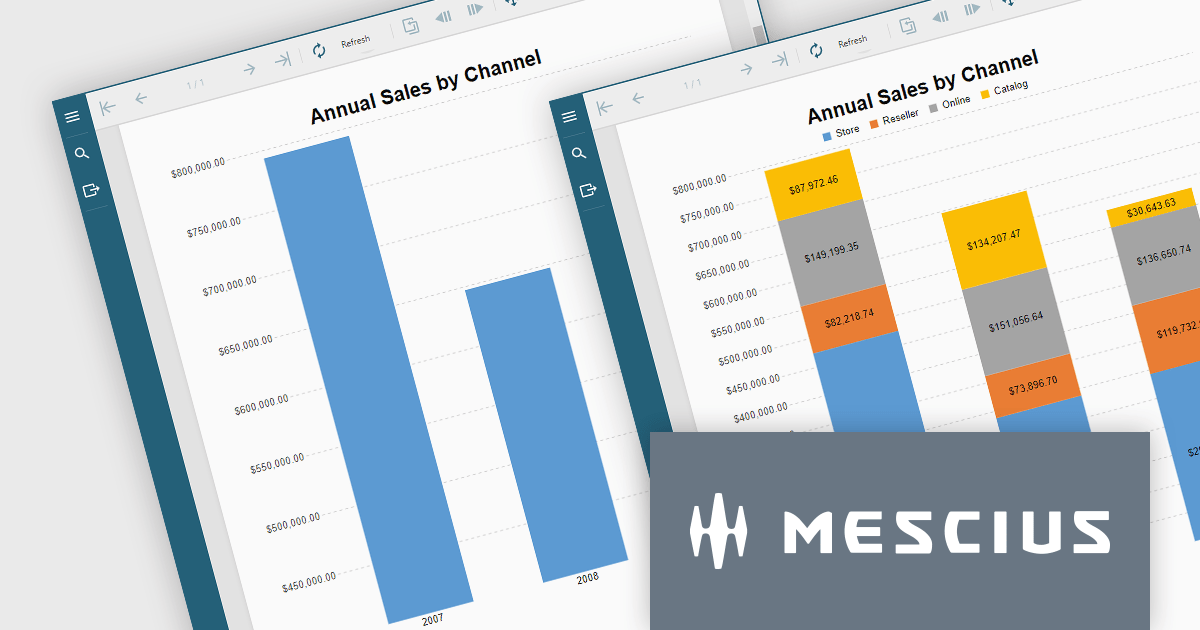
ActiveReportsJS is a reporting tool for web applications that allows developers and report authors to easily design and display reports within their applications. With a wide range of features, such as drill-down, runtime data filtering, and parameter-driven reports, as well as compatibility with popular frameworks, ActiveReportsJS simplifies the process of creating and managing reports.
In this blog post, MESCIUS Technical Engagement Engineer Joel Parks shows you how to utilize ActiveReportsJS to incoporate charts into your JavaScript report, and bind your chart data together through the use of parameterized drill-through navigation, allowing your users to easily traverse between them. Steps include:
Read the complete blog now, and start adding drill-through chart functionality to your JavaScript report using ActiveReportsJS.
ActiveReportsJS is licensed on an annual subscription or perpetual basis and is available as a Single Deployment License for non-commercial use, and as a Single Domain License or Unlimited Domain License for commercial and/or SaaS use. See our ActiveReportsJS licensing page for full details.
For more information, visit our ActiveReportsJS product page.
Offloading sorting tasks to a server (known as remote server sorting or server-side sorting) enables large datasets to be handled efficiently without overwhelming the client. This minimizes data transmission and leads to snappier web applications. Moreover, server-side sorting boosts scalability by ensuring processing happens on the server, freeing up client resources. This translates to faster response times, especially for large datasets, making the user experience smoother. This approach empowers developers to build responsive and scalable web applications that excel at managing and presenting sorted data.
Several Angular grid controls offer sorting on the remote server, including:
For an in-depth analysis of features and price, visit our comparison of Angular Grid controls.
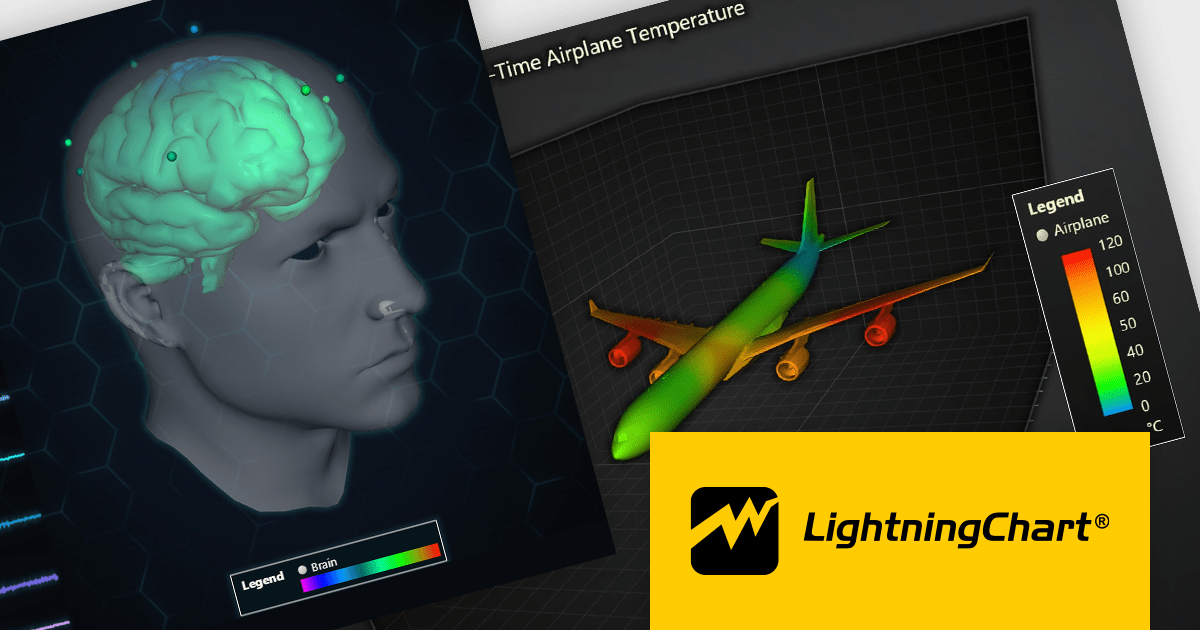
LightningChart JS is a high-performance JavaScript charting library that utilizes WebGL rendering and GPU acceleration to deliver exceptional performance for a wide range of data visualization needs. It is designed to handle large datasets and complex visualizations with ease, enabling developers to create interactive and visually appealing charts for various applications.
The LightningChart JS v5.1.0 release lets you unleash the power of complex visualizations with the new Mesh Model 3D chart type. Render intricate geometries and models with dynamic coloring pulled from a separate data set in real-time. The PaletteFill feature imbues 3D Mesh Models with vibrant colors based on vertex values, transforming your charts into captivating representations of even the most detailed 3D shapes.
To see a full list of what's new in v5.1.0, see our release notes.
LightningChart JS is licensed based on method of deployment with options including SaaS Developer Licenses, Application Developer Licenses, and Publisher Developer Licenses. Each license is perpetual and includes 1 year subscription for technical support and software updates. See our LightningChart JS licensing page for full details.
Learn more on our LightningChart JS product page.

ONLYOFFICE Docs is a comprehensive online editor, allowing users to create text documents, spreadsheets, presentations, and forms. It enables your users to edit, share, and collaborate on documents online in their preferred browser, within your own application. It's fully compatible with OOXML (Office Open XML) formats and supports popular Microsoft Office and other document formats such as CSV, DOC, DOCX, EPUB, HTML, ODP, ODS, ODT, PDF, PPT, PPTX, RTF, TXT, XLS, and XLSX.
The ONLYOFFICE Docs v8.0 update gives developers the ability to create complex, flexible forms with diverse field types and rich formatting options directly in familiar DOCXF templates. Collaborate seamlessly with colleagues and easily fill out forms from other applications, all within desktop and mobile apps. This major update caters to user feedback, promoting cross-platform compatibility and streamlined form integration for developers. Existing OFORM forms automatically convert to PDF upon opening in version 8.0.
To see a full list of what's new in v8.0.0, see our release notes.
ONLYOFFICE Docs is licensed by the number of simultaneous document connections and is available as an annual license with 1 year support and upgrades. See our ONLYOFFICE Docs licensing page for full details.
For more information, see our ONLYOFFICE Docs product page.
Touch support in a data editor refers to the capability of the software to recognize and respond to touch-based interactions on touchscreen devices. This feature enables users to manipulate and navigate data using gestures such as tapping, swiping, and pinching. Incorporating touch support into data editors enhances the user experience by providing a more intuitive and interactive interface on phones, tablets, and touchscreen monitors.
Many Angular Data Editor collections contain touch support including:
For an in-depth analysis of features and price, visit our comparison of Angular Data Editors.
전화 : 00798 14 800 6332
팩스 : +1 770 250 6199


