













공식 공급 업체
200 이상의 소프트웨어 개발처와 판매 계약을 맺은 공인 디스트리뷰터로서 합법적인 라이선스를 제공합니다.
모든 브랜드 보기.
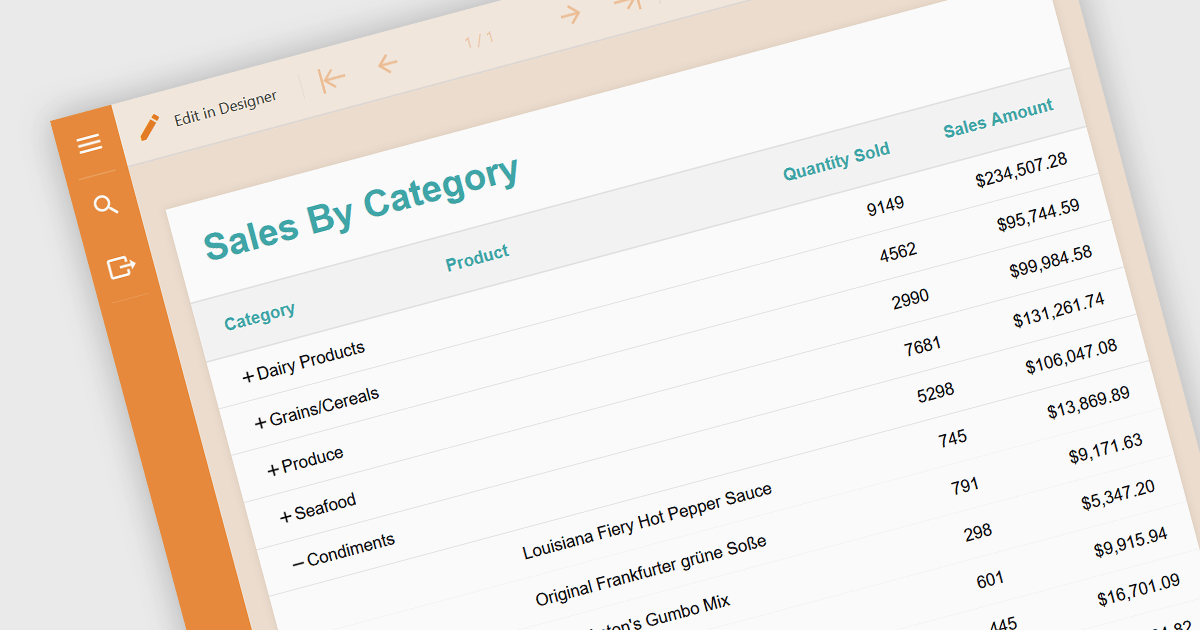
Drill-down is a feature often found in reports that allows users to explore data in greater detail, starting with a high-level summary, then clicking to navigate to progressively finer levels of detail. This helps to make complex data easier to understand and allows users to efficiently identify the underlying source of problems by iteratively analyzing successive layers of data immediately within the report. Drill-downs provide a continuous path from high-level overviews to specific data points, streamlining the process of detecting and addressing problems.
The following JavaScript reporting components offer drill-down support:
For an in-depth analysis of features and price, visit our comparison of JavaScript reporting components.
Stimulsoft Dashboards.JS is a JavaScript library designed for building interactive dashboards within web applications. It offers a comprehensive suite of tools for data processing, visualization, and dashboard design. Compatible with any HTML5 browser, it allows you to create a variety of dashboards for various purposes and integrates seamlessly with popular JavaScript frameworks like React and Vue.js.
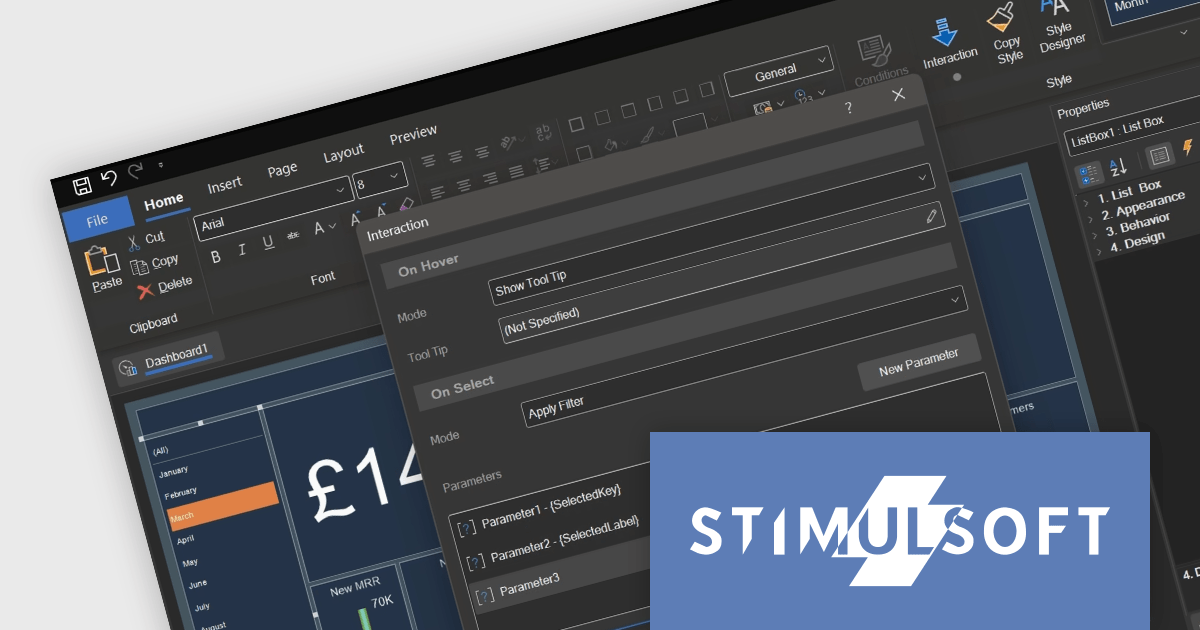
The Stimulsoft Dashboards.JS 2024.2 update adds tooltip functionality for list box, combo box and shape elements. Hovering over an item can now reveal more information, providing additional details and context on demand. This intuitive feature empowers users to explore data and grasp its meaning at a glance, enhancing overall understanding.
For full details of what's new in version 2024.2, see our release notes.
Stimulsoft Dashboards.JS is licensed per developer and is available as a Perpetual license with 1 year support and maintenance. See our Stimulsoft Dashboards.JS licensing page for full details.
Stimulsoft Dashboards.JS is available to buy in the following products:
Infragistics Professional is a comprehensive toolkit for software developers, offering a wide range of pre-built, high-performance UI components for building visually appealing and feature-rich applications across Angular, React, Web Components, Blazor, ASP.NET MVC, ASP.NET Core, Windows Forms, WPF and Xamarin. It includes controls such as data grids, charts, navigation menus, and more, along with productivity tools to streamline development processes.
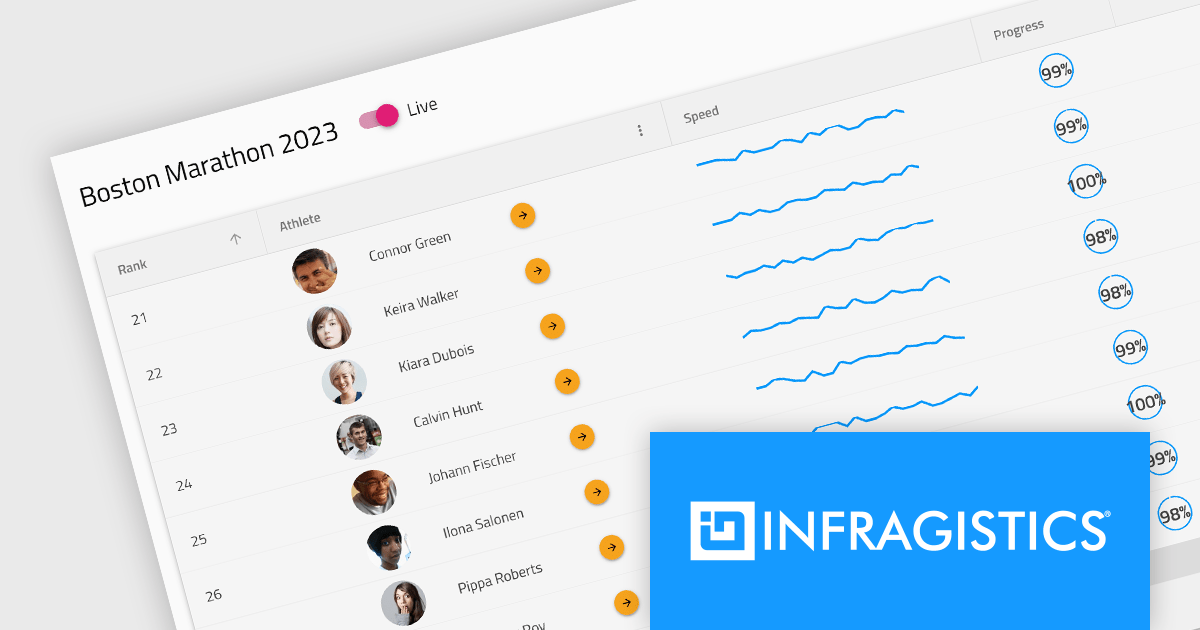
Infragistics Professional 23.2 includes the new Ignite UI Angular Data Grid, a full-featured modern component designed to enhance your data visualization capabilities. The grid boasts a rich set of features including data editing, selection, filtering, sorting, grouping, pinning, paging, templating, column moving, and exporting. This latest release brings even more functionality with collapsible column groups, column hiding, pinning, reordering, and moving capabilities. For customization, conditional styling allows for tailored aesthetics at the row or cell level. Advanced editing is empowered by a powerful API for Angular CRUD operations, and the grid also supports export to Excel, advanced filtering, and live data with real-time updates. These features, along with many more, provide a robust solution for all your data grid needs.
Infragistics Professional is licensed per developer and is available as a Perpetual License with a 1, 2 or 3 year support and maintenance subscription. See our Infragistics Professional licensing page for full details.
The Ignite UI for Angular Data Grid is available in the following products:
Kendo UI by Telerik is a comprehensive suite of JavaScript UI components offered in versions for jQuery, Angular, React, and Vue. It provides developers with over 110 pre-built widgets and tools to streamline the creation of modern, responsive, and feature-rich web applications, while maintaining a consistent API and theming across frameworks for a cohesive user experience.
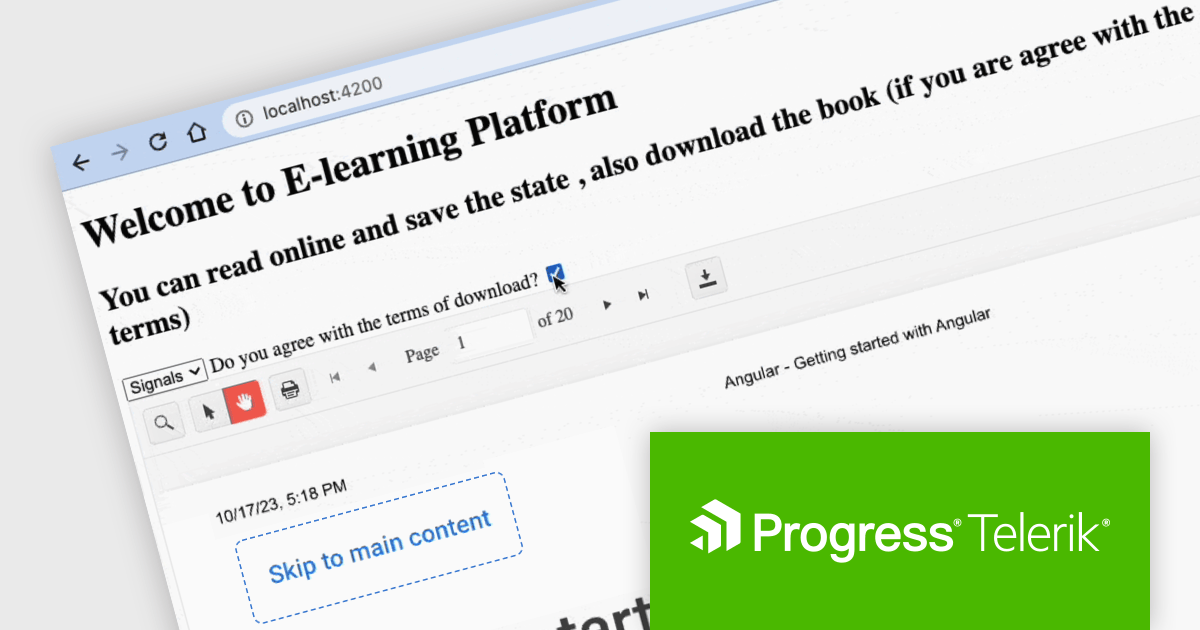
This Telerik blog post by Dany Paredes explains how to integrate the Kendo UI Angular PDF Viewer into your web applications and customize how users interact with PDFs, enhancing the user experience or even restricting downloads in specific scenarios. Steps include:
Kendo UI for Angular PDFViewer provides out-of-the-box functionalities like toolbar customization and event handling, allowing you to quickly build a feature-rich PDF Viewer with minimal code.
View the full blog to learn these valuable techniques.
Kendo UI is licensed per developer and is available as a perpetual license with a 1 year support subscription, which is available in 3 tiers: Lite, Priority or Ultimate. See our Kendo UI licensing page for full details.
Kendo UI is available to buy in the following products:

Sencha Ext JS is a comprehensive JavaScript framework for building data-intensive, cross-platform web and mobile applications for any modern device. Ext JS includes 140+ pre-integrated and tested high-performance UI components such as HTML5 calendar, grids, pivot grid, D3 adapter, trees, lists, forms, menus, toolbars, panels, windows, and much more.
In this blog post by Sencha Sales Engineer Andres Villalba you will learn the steps to use the power of ChatGPT to unlock your Ext JS potential. This includes:
The article also links to a recording of Andres's full session at JS Days, so you can watch as he takes you through the process, step by step.
Read the complete blog and find out how to save development time when building your next Ext JS JavaScript with ChatGPT.
Sencha Ext JS is available in Pro, Enterprise and Ultimate editions, as Annual Subscription or Perpetual Licenses. See our Sencha Ext JS licensing page for full details.
For more information, see our Sencha Ext JS product page.
전화 : 00798 14 800 6332
팩스 : +1 770 250 6199


