


공식 공급 업체
200 이상의 소프트웨어 개발처와 판매 계약을 맺은 공인 디스트리뷰터로서 합법적인 라이선스를 제공합니다.
모든 브랜드 보기.
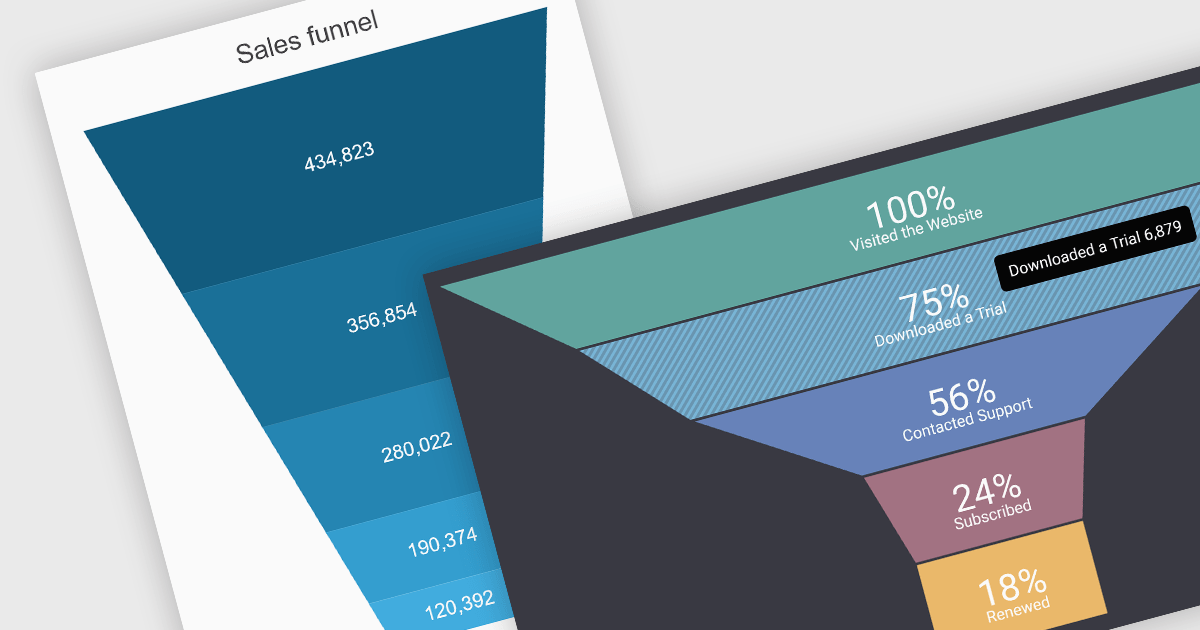
A funnel chart is a type of visualization that graphically depicts the stages of a process and the progressive flow of values through those stages. It gets its name from its shape, typically resembling a funnel with a wide top and narrow base. Funnel charts are particularly useful in sales and marketing contexts for tracking potential customers as they move through the sales pipeline, identifying bottlenecks, and pinpointing areas where performance might be improved.
Several jQuery chart controls offer Funnel charts including:
For an in-depth analysis of features and price, visit our jQuery chart controls comparison.
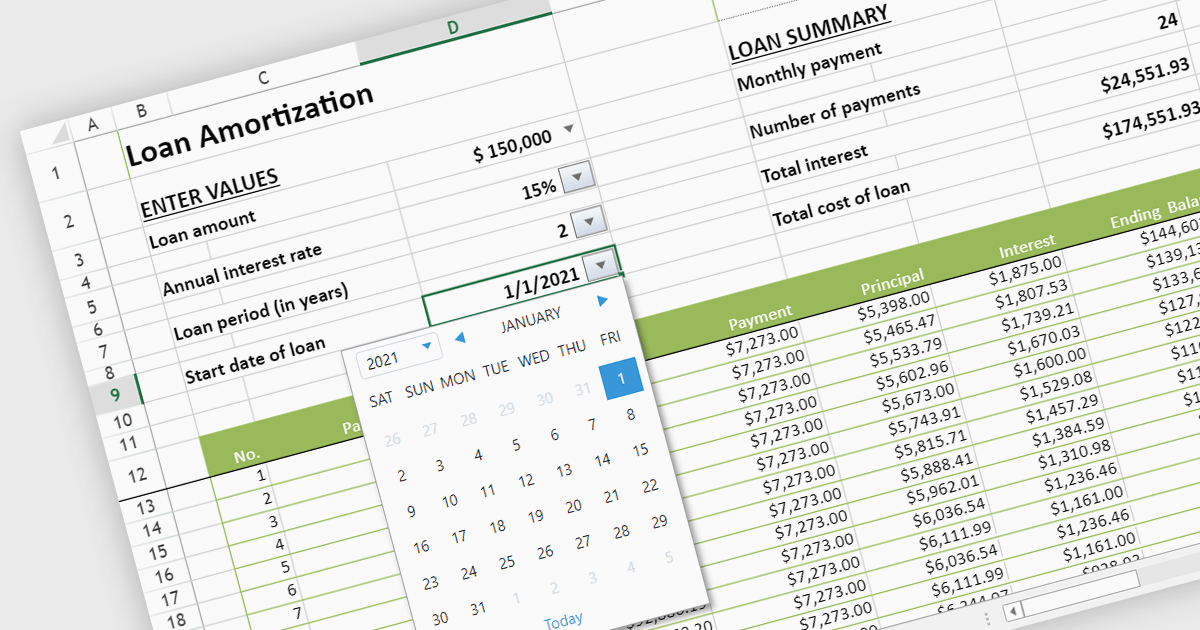
Using varied cell types in spreadsheets enhances organization, efficiency, and clarity. Text-based cells streamline labeling and categorization, while numeric cells enable calculations and analysis. Date and time cells simplify the tracking of schedules and deadlines. Formulas automate complex computations, and logical cells support conditional formatting and decision-making processes. This diversity in cell types optimizes data representation and manipulation, making your spreadsheets more powerful and versatile tools.
Several JavaScript spreadsheet controls offer support for different cell types, including:
For an in-depth analysis of features and price, visit our comparison of JavaScript Spreadsheet controls.
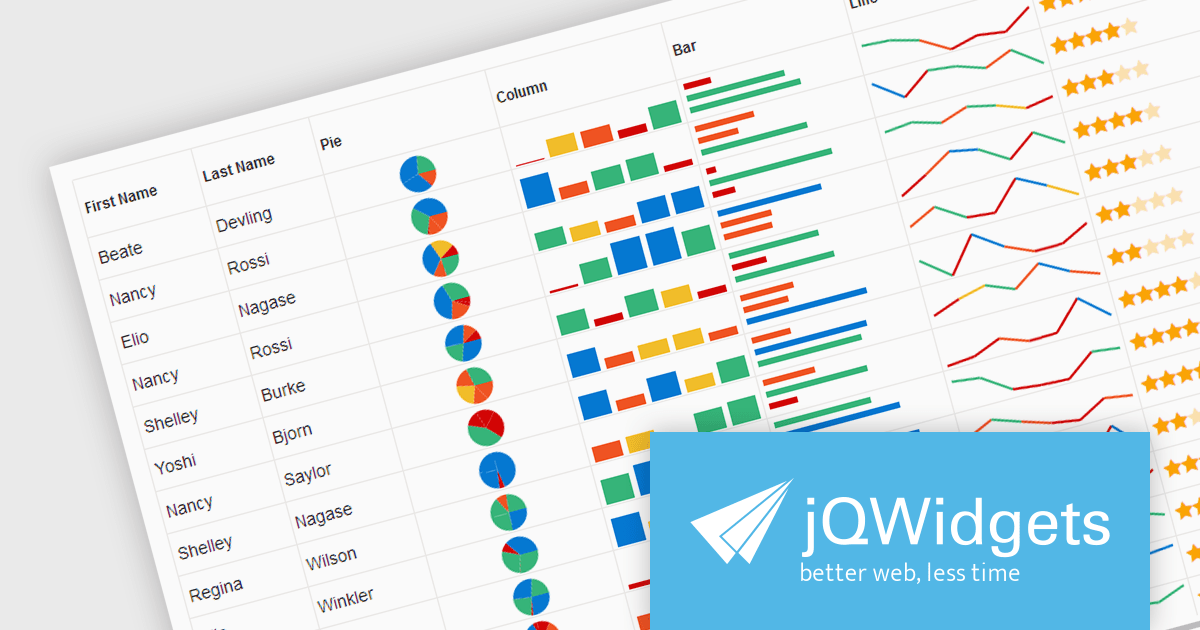
jQWidgets is a comprehensive JavaScript UI framework offering a robust collection of over 60 widgets, themes, and utilities for building professional-grade, cross-platform web applications. Built on jQuery, HTML5, and CSS, it provides extensive functionality including data grids, charts, navigation, input validation, and more. jQWidgets simplifies web development, ensuring your applications work seamlessly across desktop browsers, tablets, and smartphones.
The jQWidgets v19 release introduces support for integrating sparklines directly into jqxGrid. These miniature charts, plotted directly within grid cells, provide a quick and insightful way to visualize trends and patterns in your data without requiring additional charting libraries. This enhancement significantly bolsters jqxGrid's data visualization capabilities, allowing you to create more informative and engaging data presentations.
To see a full list of what's new in v19.0.0, see our release notes.
jQWidgets is licensed per developer and is available as a Perpetual license 1 year support and maintenance. See our jQWidgets licensing page for full details.
Learn more on our jQWidgets product page.
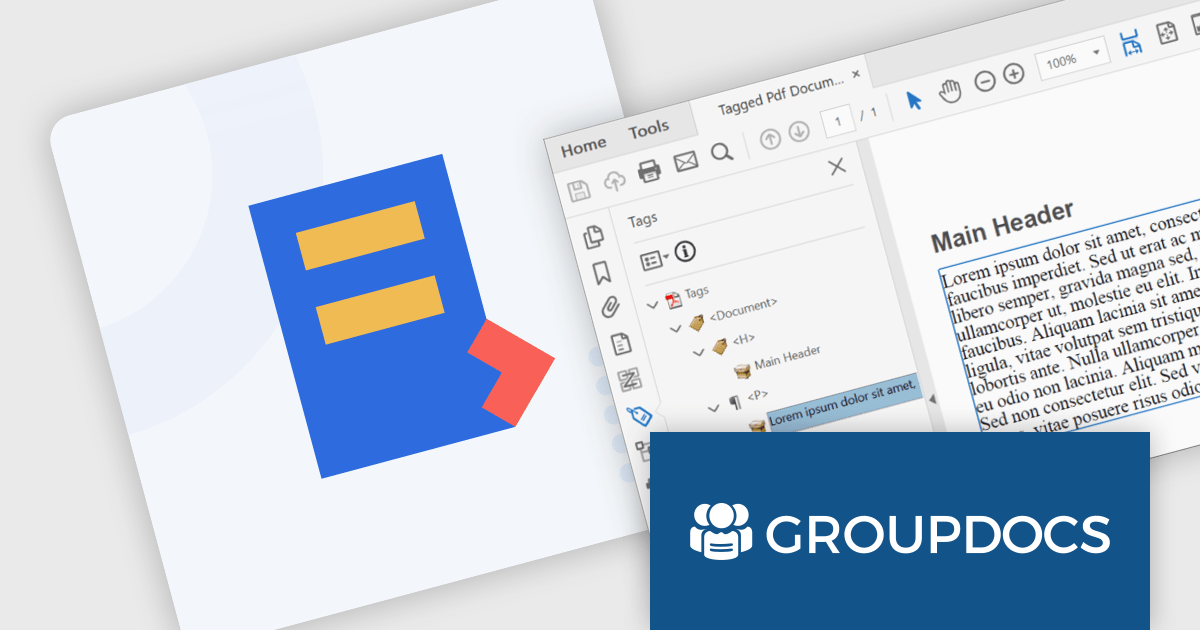
GroupDocs.Conversion for Node.js via Java is a powerful document conversion API designed to seamlessly integrate with your JavaScript applications. It empowers you to effortlessly convert between over 50 document and image formats, including popular Microsoft Office and OpenDocument files, PDFs, and various image types. This Java-based solution eliminates the need for third-party tools, offering a convenient and efficient way to handle document conversions directly within your Node.js projects.
The GroupDocs.Conversion for Node.js via Java V24.2 release adds the ability to convert tagged DOCX files to tagged PDF. This feature ensures the accurate transfer of semantic structure, including headings, paragraphs, tables, and other essential elements, from DOCX to PDF. This empowers users with disabilities to leverage screen readers and other assistive technologies effectively, promotes content clarity and comprehension, and safeguards crucial information during format changes, making your documents accessible.
To see a full list of what's new in V24.2, see our release notes.
GroupDocs.Conversion for Node.js via Java is offered as Developer Small Business, Developer OEM, Site Small Business and Site OEM licenses catering to a range of business needs. Licenses are perpetual, and include 1 year of support and maintenance. Subscription renewals are also available. See our GroupDocs.Conversion for Node.js via Java licensing page for full details.
GroupDocs.Conversion for Node.js via Java is available in the following products:
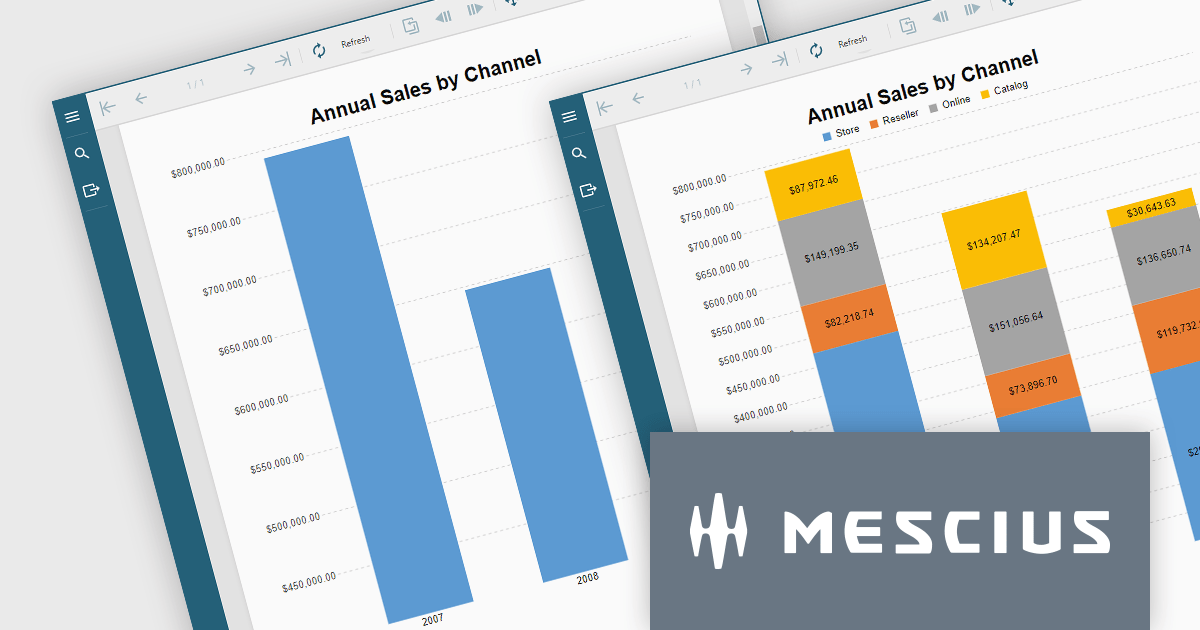
ActiveReportsJS is a reporting tool for web applications that allows developers and report authors to easily design and display reports within their applications. With a wide range of features, such as drill-down, runtime data filtering, and parameter-driven reports, as well as compatibility with popular frameworks, ActiveReportsJS simplifies the process of creating and managing reports.
In this blog post, MESCIUS Technical Engagement Engineer Joel Parks shows you how to utilize ActiveReportsJS to incoporate charts into your JavaScript report, and bind your chart data together through the use of parameterized drill-through navigation, allowing your users to easily traverse between them. Steps include:
Read the complete blog now, and start adding drill-through chart functionality to your JavaScript report using ActiveReportsJS.
ActiveReportsJS is licensed on an annual subscription or perpetual basis and is available as a Single Deployment License for non-commercial use, and as a Single Domain License or Unlimited Domain License for commercial and/or SaaS use. See our ActiveReportsJS licensing page for full details.
For more information, visit our ActiveReportsJS product page.
전화 : 00798 14 800 6332
팩스 : +1 770 250 6199


