


공식 공급 업체
200 이상의 소프트웨어 개발처와 판매 계약을 맺은 공인 디스트리뷰터로서 합법적인 라이선스를 제공합니다.
모든 브랜드 보기.
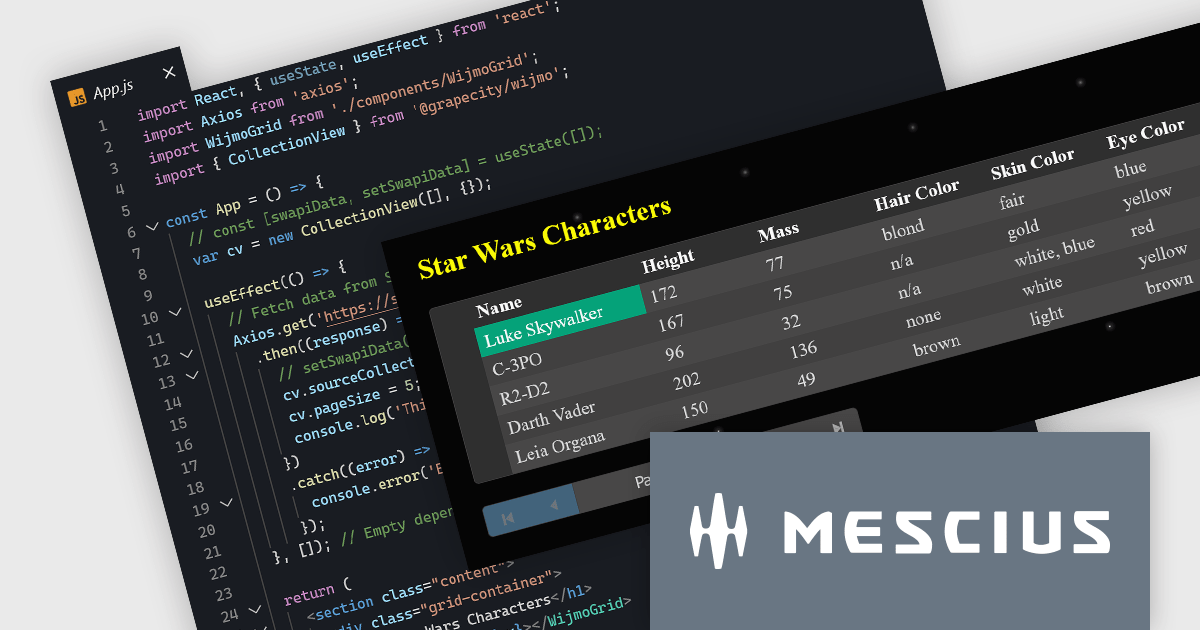
Wijmo by MESCIUS is a comprehensive suite of JavaScript UI components and data grids designed for building modern, performant enterprise applications. It offers a rich library of customizable elements like charts, gauges, calendars, and grids, compatible with popular frameworks like Angular, React, and Vue. Wijmo boasts efficient data handling, accessibility features, and regular updates, making it a popular choice for developers seeking to enhance their web app's interactivity and visual appeal. Wijmo's FlexGrid component provides a JavaScript UI datagrid which includes built-in sorting, formatting, pagination, and flexible data binding.
In this blog post, MESCIUS Technical Engagement Engineer Andrew Peterson takes you through the process for building a React application to fetch and display data using the WijmoGrid Component. Steps include:
Read the full blog post and get started creating immersive and visually appealing React applications.
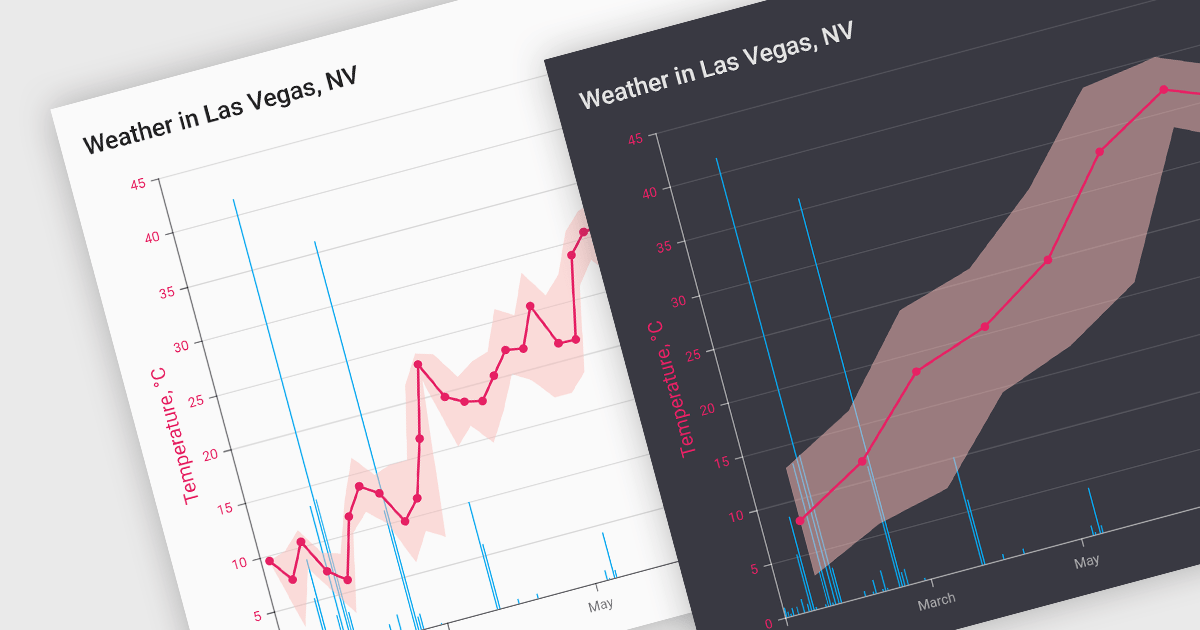
Data aggregation functionality in charts refers to the process of combining and summarizing raw data to provide a more concise and understandable representation. This technique involves collecting and grouping data points based on specific criteria, such as time intervals, categories, or geographic regions, and then calculating summary statistics, such as averages, totals, or percentages. The aggregated data is then used to create charts and graphs that offer a comprehensive overview of trends, patterns, or comparisons within the dataset. This approach helps in simplifying complex datasets and makes them more accessible for analysis, allowing decision-makers to derive meaningful insights and draw informed conclusions from the visual representation of aggregated information.
Several React chart controls support data aggregation including:
For an in-depth analysis of features and price, visit our React Chart Controls comparison.
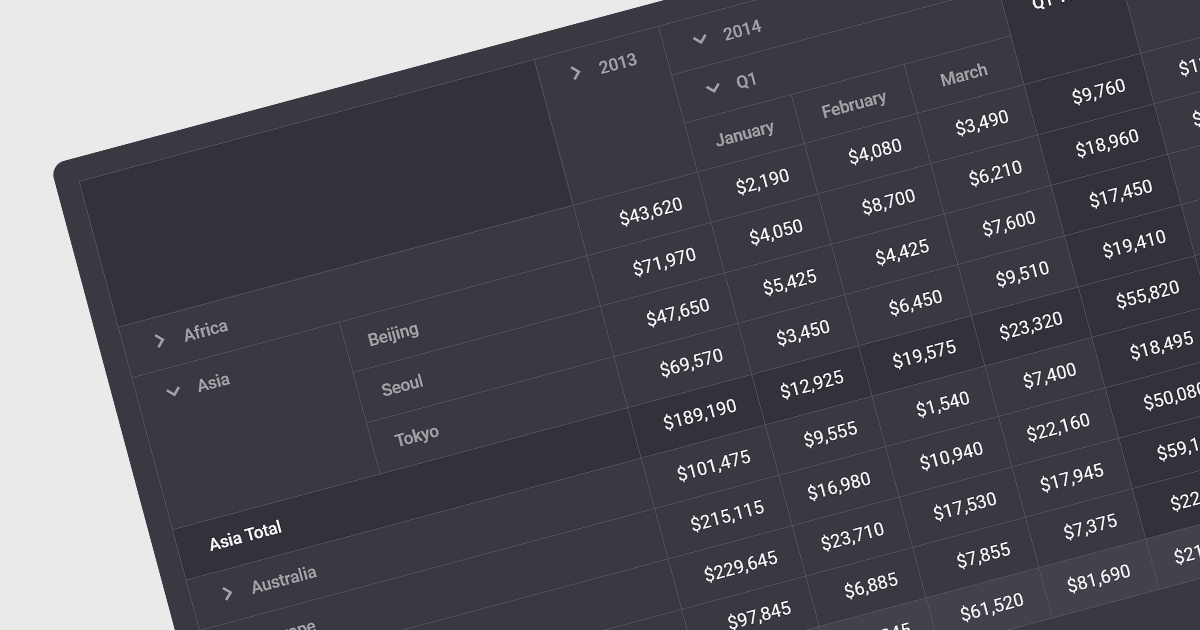
Drill-down capability within a grid control is a user-interactive feature that allows deeper exploration of summarized data. By clicking on specific cells or groups, users navigate down through hierarchical levels, uncovering increasingly granular details hidden within the aggregated view. This empowers informed decision-making by readily accessing both summarized overviews and underlying individual records, all within the familiar grid interface.
Several Angular grid controls offer drill-down capability including:
For an in-depth analysis of features and price, visit our Angular grid controls comparison.
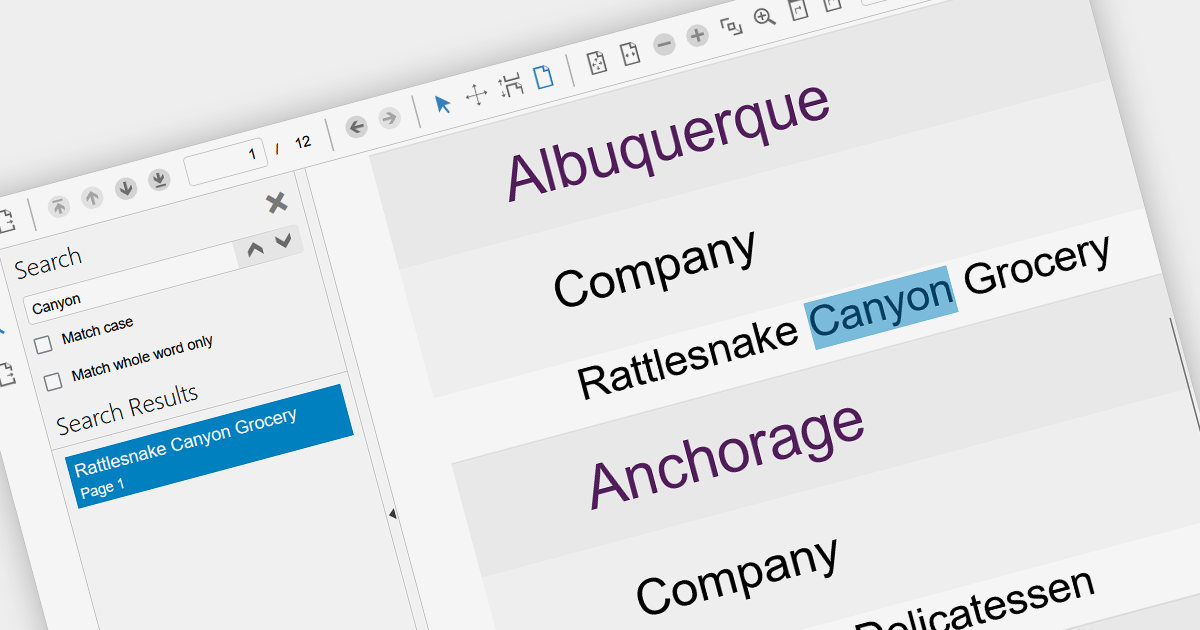
Leveraging a JavaScript PDF component with search functionality empowers dynamic user experiences within static PDF documents. Users gain immediate access to relevant information through keyword searches, boosting document accessibility and efficiency. This interactivity enhances user engagement, improves information retrieval, and reduces navigation time, fostering a more productive and satisfying user journey. Integrating search directly within the PDF eliminates reliance on external tools, streamlining workflows and centralizing information within the document itself.
Several JavaScript PDF Viewers offer search functionality including:
For an in-depth analysis of features and price, visit our JavaScript PDF Viewer comparison.
KendoReact by Telerik is a professional UI kit of more than 120 responsive and customizable native UI and DataViz components for React developers. Designed to save time building powerful high performance React apps, it helps ensure a modern, consistent look-and-feel across your app's UI.
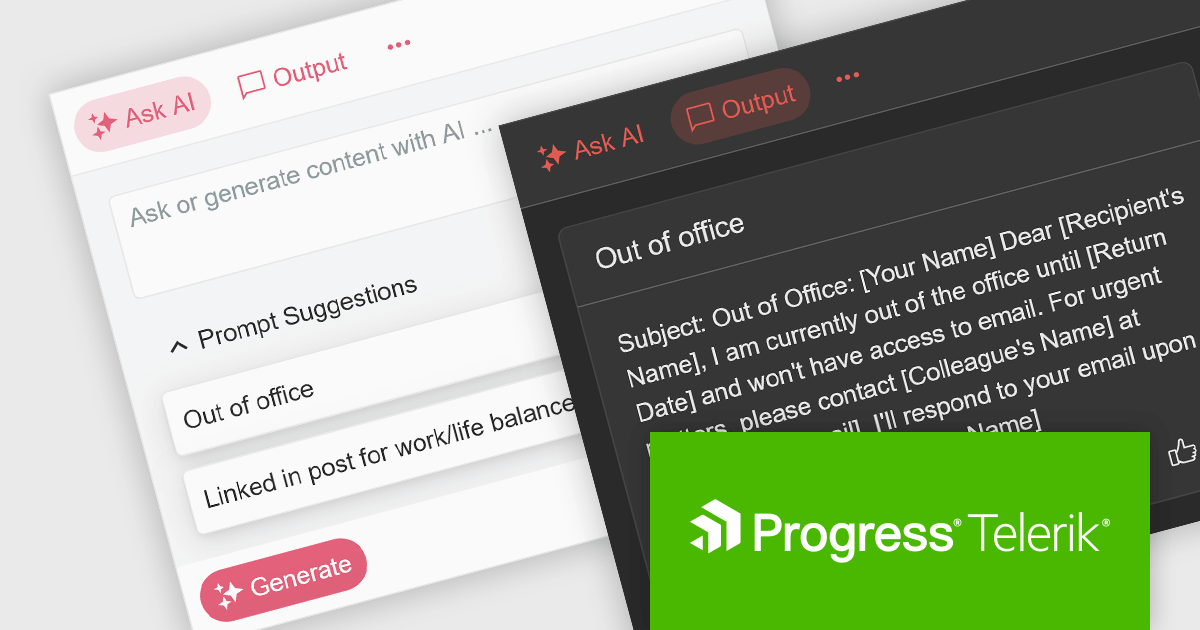
KendoReact v7.1.0, which is part of the 2024 Q1 release, introduces an "AIPrompt" component which allows React developers to integrate generative AI services into their applications. With it you can set up custom suggestions to actively guide users, customize the generate button and prompt input field, and define custom prompt commands so it will do a certain action when a specific command is given. This component also enables you to adapt its behaviour based on user interaction, to ensure it responds smoothly, as it emits several user triggered events. This will help to give your application a modern, customizable and seamless UI.
To see a full list of what’s new in 2024 Q1 (v7.1.0), see our release notes.
KendoReact is licensed per developer and is available as a perpetual license with a 1 year support subscription, which is available in 3 tiers: Lite, Priority or Ultimate. See our KendoReact licensing page for full details.
KendoReact is available to buy in the following products:
전화 : 00798 14 800 6332
팩스 : +1 770 250 6199


