













공식 공급 업체
200 이상의 소프트웨어 개발처와 판매 계약을 맺은 공인 디스트리뷰터로서 합법적인 라이선스를 제공합니다.
모든 브랜드 보기.
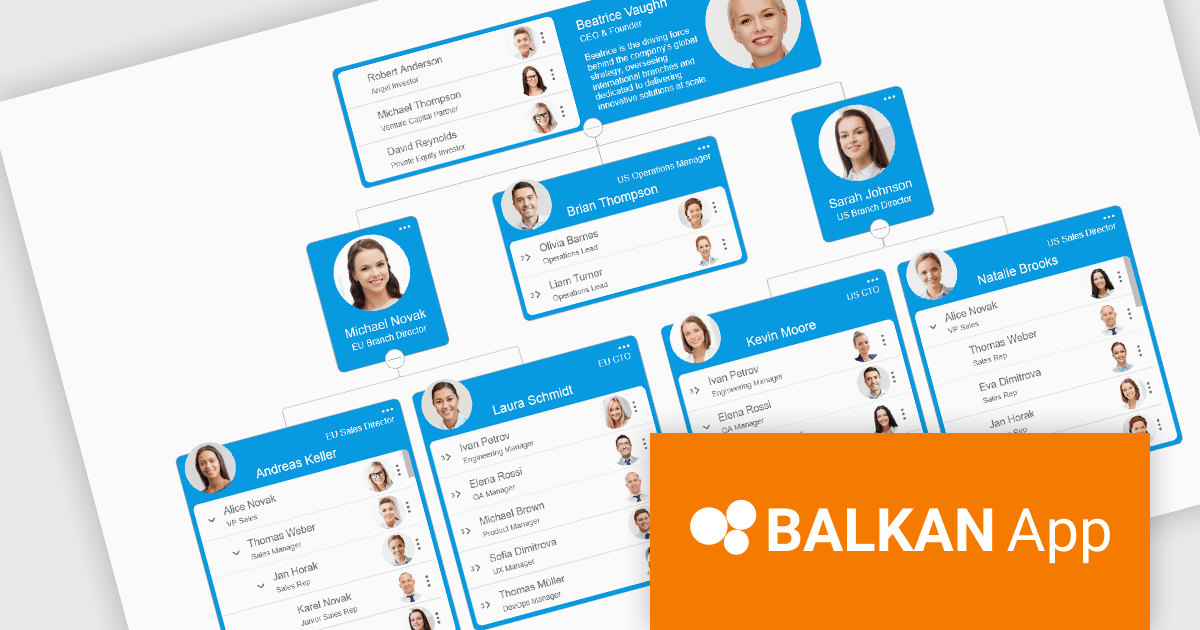
OrgChart JS by BALKAN App is a JavaScript library designed for creating flexible, interactive and customizable organizational charts for presenting structural data. This visual tool helps managers illustrate the roles and hierarchy of an organization, supporting a variety of features, including grouping, assistant nodes, expand/collapse, a built-in search field, and multi-format exports for example to PDF, PNG, SVG or CSV. Compatible with all modern browsers, it supports thousands of nodes without any impact on performance, and offers extensive customization, giving users a versatile and efficient tool for visualizing hierarchical data structures in web applications.
OrgChart JS includes the Tree List Layout, offering a space-efficient and readable way to represent hierarchical data by combining a tree structure with a linear list, enabling developers to display deeply nested hierarchies without the horizontal sprawl of traditional node-link diagrams. It allows nodes to be expanded and collapsed within a vertically aligned list, improving navigation and scalability while maintaining parent-child relationships, and supporting extensive nesting without compromising usability. This makes it particularly useful in scenarios with limited screen space or large datasets, where reducing visual complexity while preserving the full hierarchy is essential, such as administrative dashboards and data management interfaces.
OrgChart JS is licensed based on usage, offering single website, unlimited websites or SaaS, and OEM licenses. It is available as a perpetual license with 1 year maintenance and technical support. See our OrgChart JS licensing page for full details.
For more information, see our OrgChart JS product page.
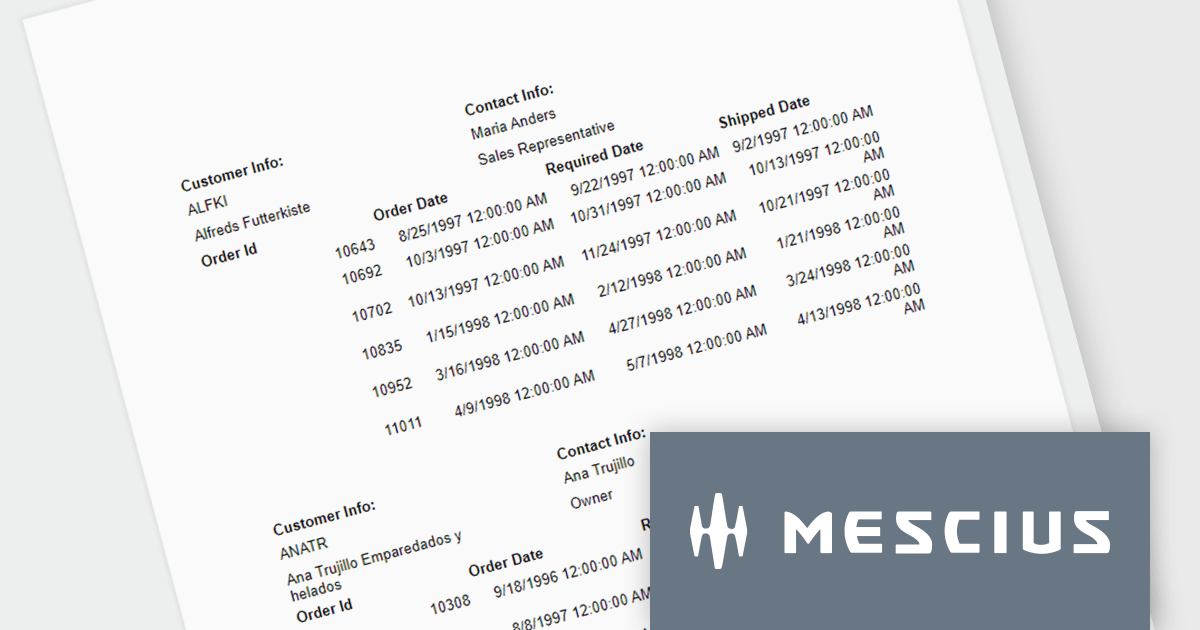
ActiveReportsJS is a powerful, lightweight reporting tool designed to integrate advanced reporting capabilities into any JavaScript application. ActiveReportsJS enables developers to create, view, export, and print richly formatted reports entirely on the client side - with zero server dependencies.
In this blog post, MESCIUS Product Consultant Victor Stahlman demonstrates how to build nested data regions in ActiveReportsJS to create master-detail reports that display related data, such as customers and their orders, within a structured layout. He walks your through configuring datasets, nesting controls like Lists and Tables, and applying filters to correctly link and present hierarchical data relationships in your reports. Key topics include:
By implementing nested data regions in ActiveReportsJS, you can transform flat datasets into structured, master-detail reports that are easier to read and analyze.
Read the complete blog to get started building scalable, dynamic JavaScript reports that deliver more meaningful insights to your users.
ActiveReportsJS is licensed on an annual subscription or perpetual basis and is available as a Single Deployment License for non-commercial use, and as a Single Domain License or Unlimited Domain License for commercial and/or SaaS use. See our ActiveReportsJS licensing page for full details.
For more information, visit our ActiveReportsJS product page.
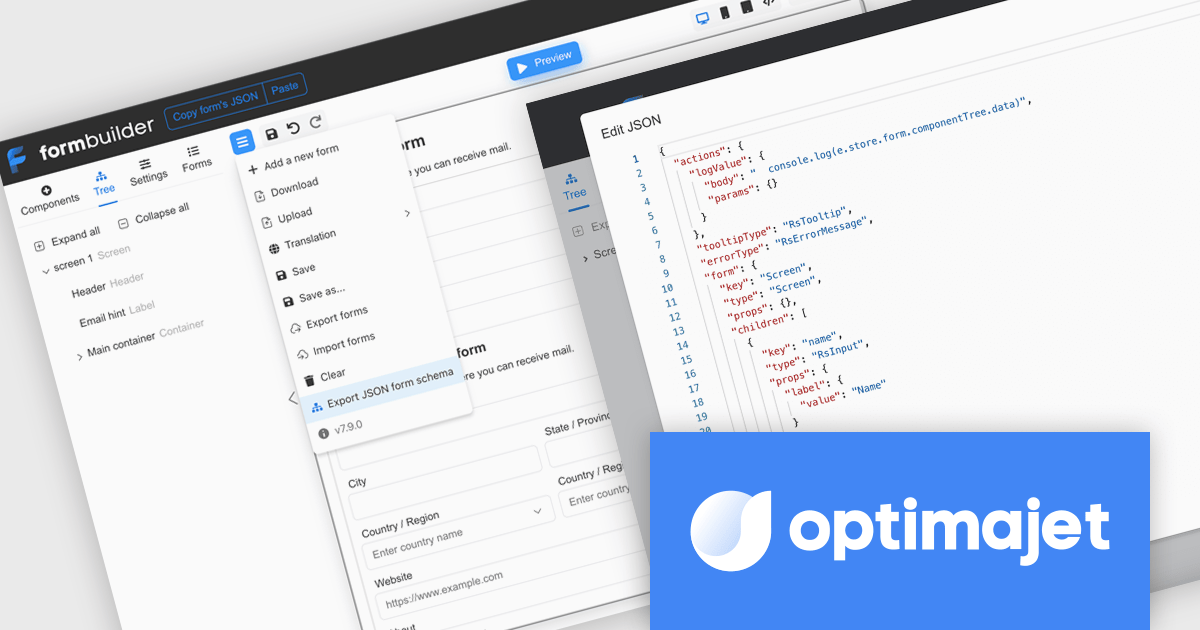
Optimajet FormEngine is a drag-and-drop React form builder that lets teams create, manage, and render complex web forms without writing frontend code. It allows developers and business users to visually design forms, store them as JSON, and render them at runtime. As a React JS library, it easily integrates into existing applications while giving developers full control over form logic, structure, and data flow, making it well suited for complex data collection.
Optimajet FormEngine enables JSON Schema validation for forms, allowing developers to validate form JSON directly within their IDE, identify structural issues, incorrect data types, and unsupported configurations early in the development process, and enforce a consistent, well-defined structure across all forms. By providing real-time feedback, inline error highlighting, and autocomplete suggestions, it improves accuracy and reduces the need for repeated testing cycles, helping developers work more efficiently while minimizing runtime errors and ensuring more reliable form implementations.
Optimajet FormEngine is licensed based on usage type (internal commercial use, public web/SaaS, or OEM embedding), number of domains for the visual editor, and access to additional ready-made components. Licenses are perpetual and include 6 months or 1 year of updates and support. See our Optimajet FormEngine licensing page for full details.
For more information, visit our Optimajet FormEngine product page.
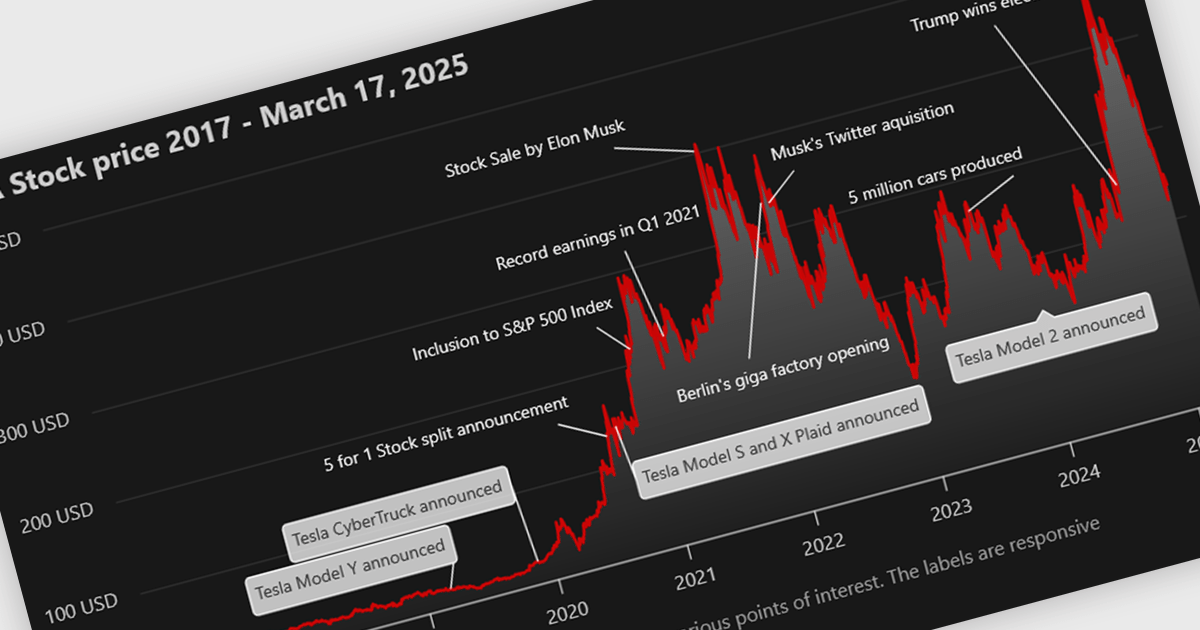
Annotation support in a Vue.js chart component refers to the capability to overlay additional contextual elements, such as labels, markers, lines, or regions, directly onto a chart to highlight specific data points, thresholds, or events. This feature enables developers to enrich visualizations with meaningful insights without altering the underlying dataset, making it easier to communicate key information such as trends, anomalies, or business rules within the UI.
Several Vue.js chart components support chart annotations, including:
For an in-depth analysis of features and price, visit our comparison of Vue.js charting components.
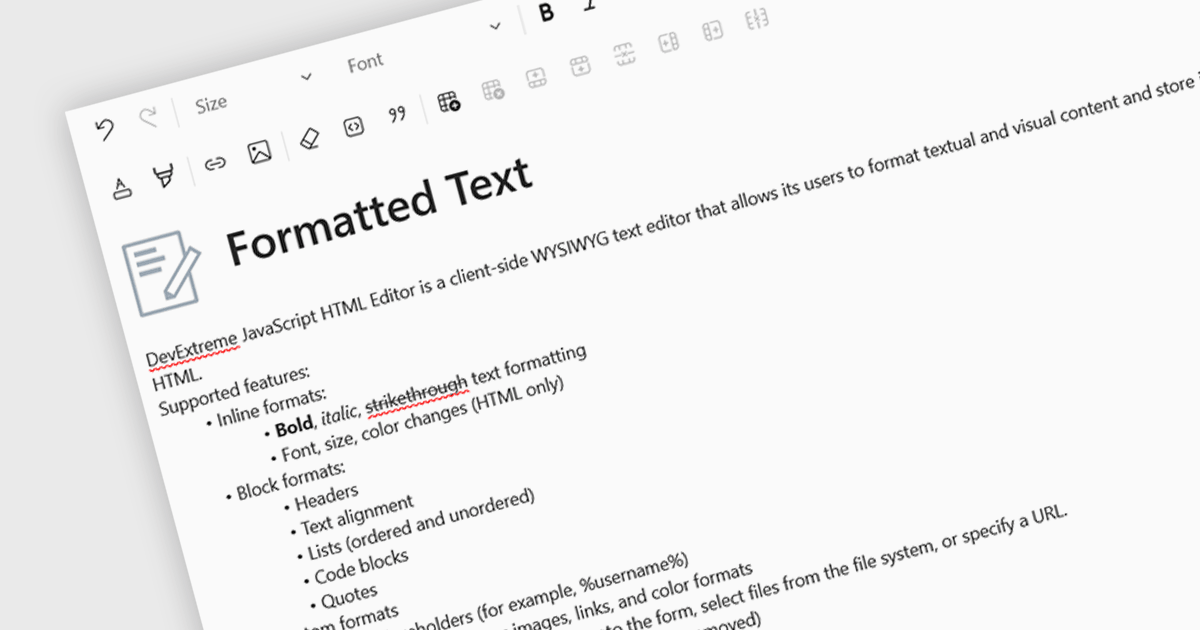
An RTF (Rich Text Format) editor allows users to create and modify formatted text, such as bold, italics, fonts, colors, and embedded elements. This capability is particularly useful in applications where descriptive or user-generated content must retain presentation alongside data, such as CMS platforms, reporting tools, or enterprise data grids. By integrating rich text editing at the component level, it enables more expressive data entry, reduces the need for external editors, and ensures formatting consistency when storing and rendering content across systems.
Several React data editor collections include RTF (rich text format) functionality, including:
For an in-depth analysis of features and price, visit our comparison of React data editors.
전화 : 00798 14 800 6332
팩스 : +1 770 250 6199


