


공식 공급 업체
200 이상의 소프트웨어 개발처와 판매 계약을 맺은 공인 디스트리뷰터로서 합법적인 라이선스를 제공합니다.
모든 브랜드 보기.
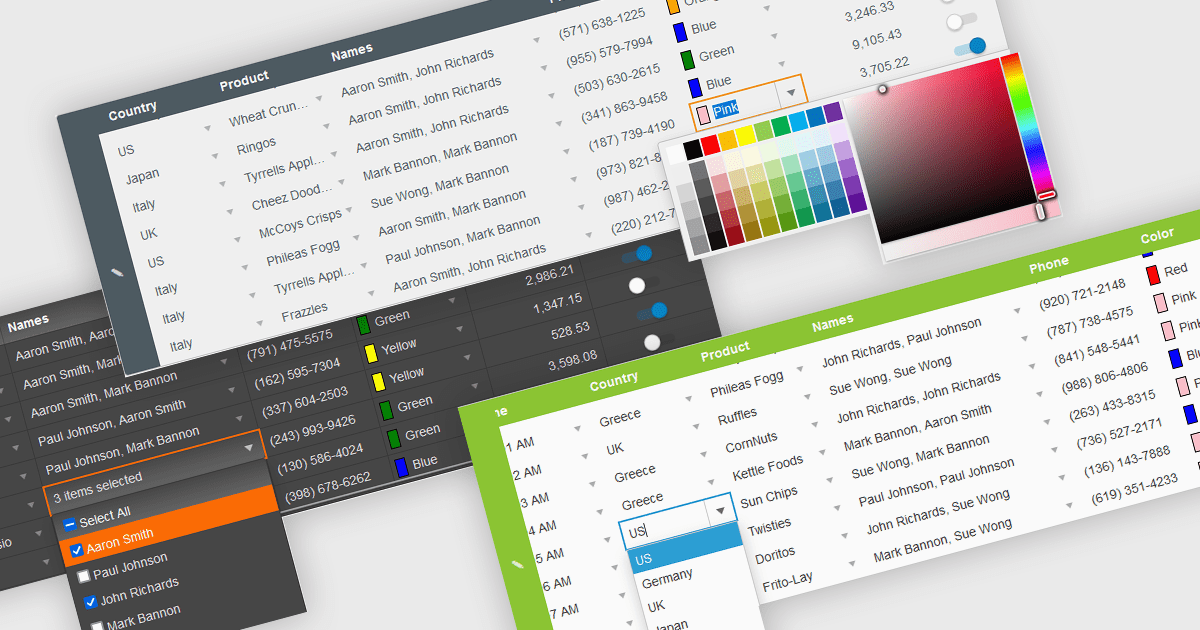
In the field of data editors, themes are style configurations that define the visual appearance and behavior of the interface. They provide developers with a consistent design framework, ensuring alignment with brand guidelines while enhancing usability and accessibility. By supporting features like dark and light modes, responsive design, and unified styling across components, themes enable developers to create a visually cohesive and user-friendly experience. They streamline maintenance, improve scalability, and reduce development overhead by offering a centralized system for managing design updates and ensuring consistency throughout the application.
Several React data editor collections offer support for themes including:
For an in-depth analysis of features and price, visit our React data editor controls comparison.
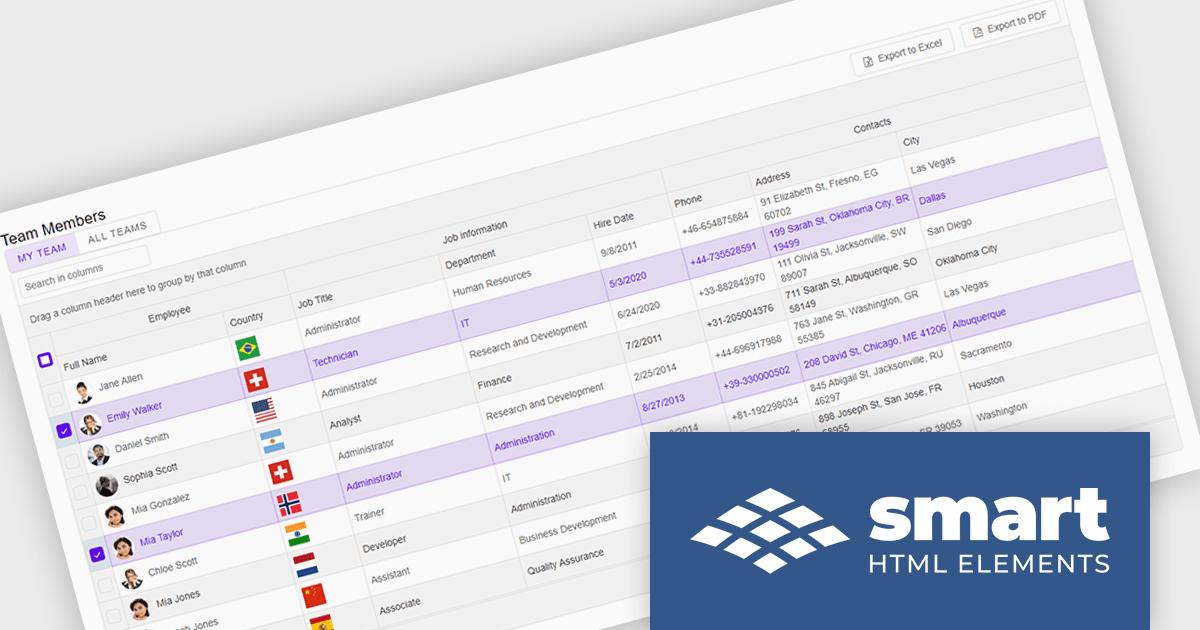
Smart UI by Smart HTML Elements is an enterprise-grade UI library offering pre-built web components for developers in Angular, React, Vue, Blazor, and JavaScript. It boasts over 60 ready-to-use components like grids, charts, schedulers, and editors, all featuring two-way data binding, responsiveness, accessibility, and theming capabilities. This library helps developers rapidly build dynamic and modern web applications with consistent look-and-feel and rich functionalities, accelerating development time and ensuring professional quality.
The Smart UI v21.0.0 release introduces significant enhancements to grid Excel export functionality. Users can now export one or more images from grids or components directly into Excel files and limit exports to selected rows or cells. These features provide greater flexibility, enabling users to include precisely the data they need while adding visual context to enhance understanding. The ability to tailor exports in this way ensures clearer communication of the underlying meaning and significance of the data.
To see a full list of what's new in v21.0.0, see our release notes.
Smart UI (Smart HTML Elements) is licensed per developer and is available as a perpetual license with 1 year support and maintenance. It includes distribution to unlimited Web applications, SaaS projects, Intranets and Websites. Team, OEM and Enterprise licensing options are also available. See our Smart UI licensing page for full details.
Learn more on our Smart UI product page.
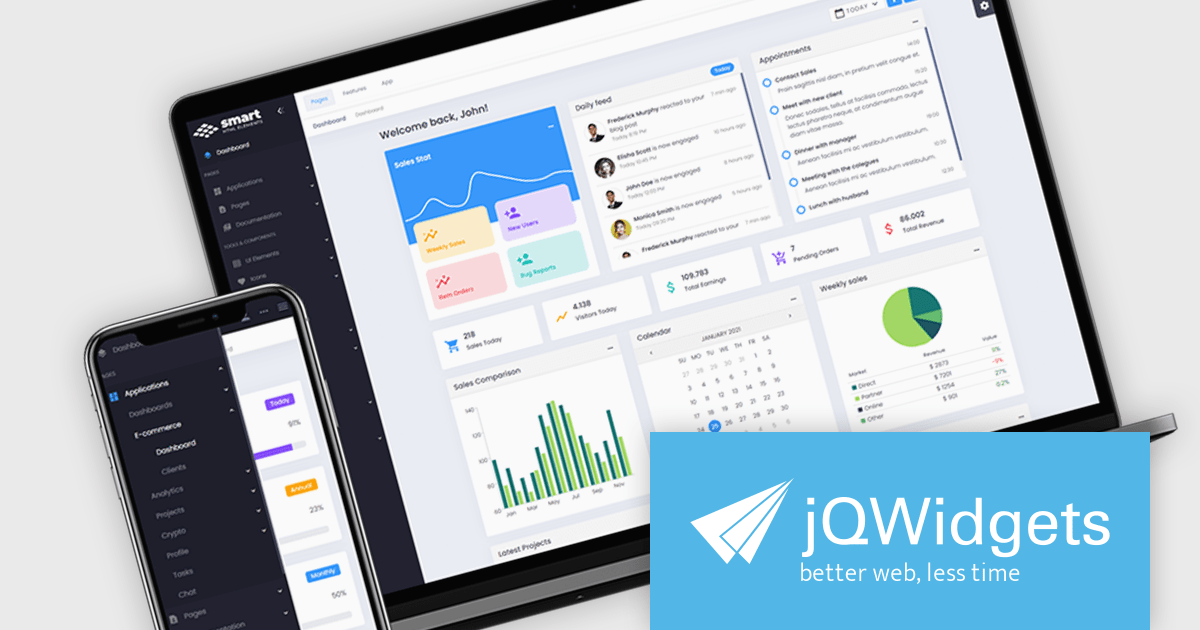
jQWidgets is a comprehensive JavaScript UI framework offering a robust collection of over 60 widgets, themes, and utilities for building professional-grade, cross-platform web applications. Built on jQuery, HTML5, and CSS, it provides extensive functionality including data grids, charts, navigation, input validation, and more. jQWidgets simplifies web development, ensuring your applications work seamlessly across desktop browsers, tablets, and smartphones.
The jQWidgets v21.0.0 release adds support for Angular 19 enabling developers to build modern, high-performance web applications with a rich set of pre-built, customizable UI components. This update ensures seamless integration with the latest Angular features, improves compatibility, and provides access to the latest performance optimizations and security enhancements. By leveraging jQWidgets, developers can accelerate development cycles, enhance user experiences, and create robust, scalable Angular applications.
To see a full list of what's new in v21.0.0, see our release notes.
jQWidgets is licensed per developer and is available as a Perpetual license 1 year support and maintenance. See our jQWidgets licensing page for full details.
Learn more on our jQWidgets product page.
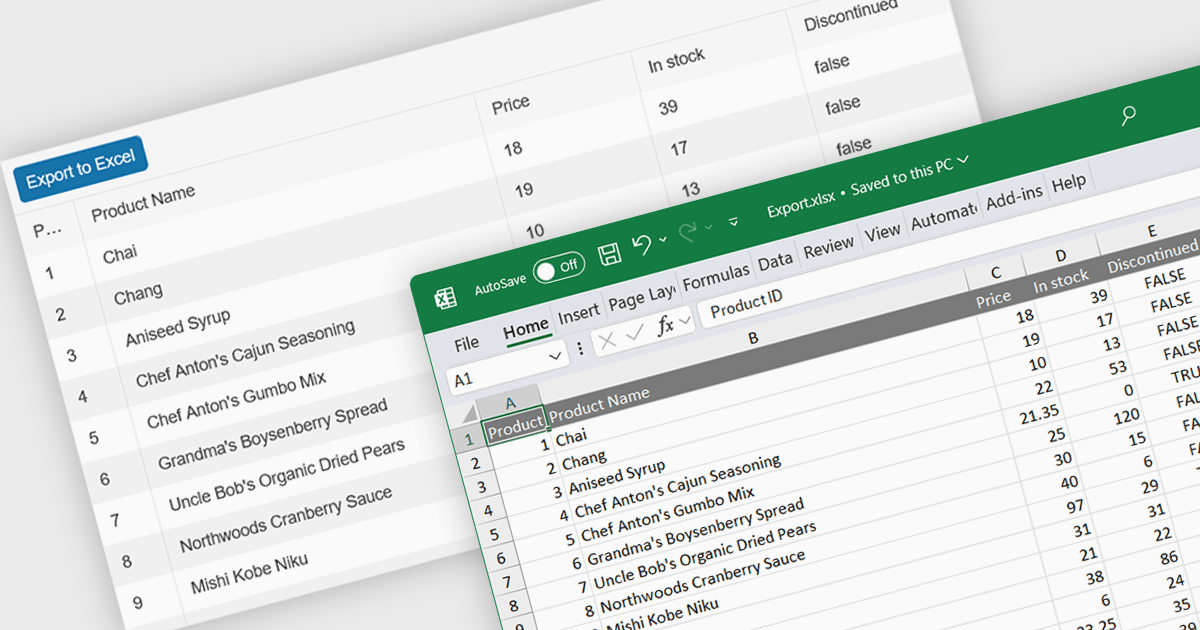
Spreadsheet component with XLSX export functionality allow users to output spreadsheet data into the industry standard Excel-compatible format. This feature is especially useful for applications where data needs to be analyzed, shared, or integrated into external workflows. By enabling XLSX export, users can download structured data directly from the web application in a format widely supported across platforms and software. The benefits of this functionality include maintaining data accuracy, preserving formatting, and supporting large datasets with advanced features like formulas, filters, and charts. Use cases for XLSX export range from financial dashboards and inventory management systems to data analytics platforms and collaborative tools, offering users the flexibility to work offline or share data in a familiar format.
Several React spreadsheet components offer XLSX export, including:
For an in-depth analysis of features and price, visit our React spreadsheet controls comparison.
Kendo UI by Telerik is a comprehensive suite of JavaScript UI components designed to accelerate web application development. Offering pre-built, customizable elements for grids, charts, schedulers, and more, it streamlines UI creation across popular frameworks like jQuery, Angular, React, and Vue. Key features include responsive design, accessibility, and high performance, enhancing user experience. Developers benefit from reduced development time, consistent UI patterns, and the ability to build feature-rich applications faster.
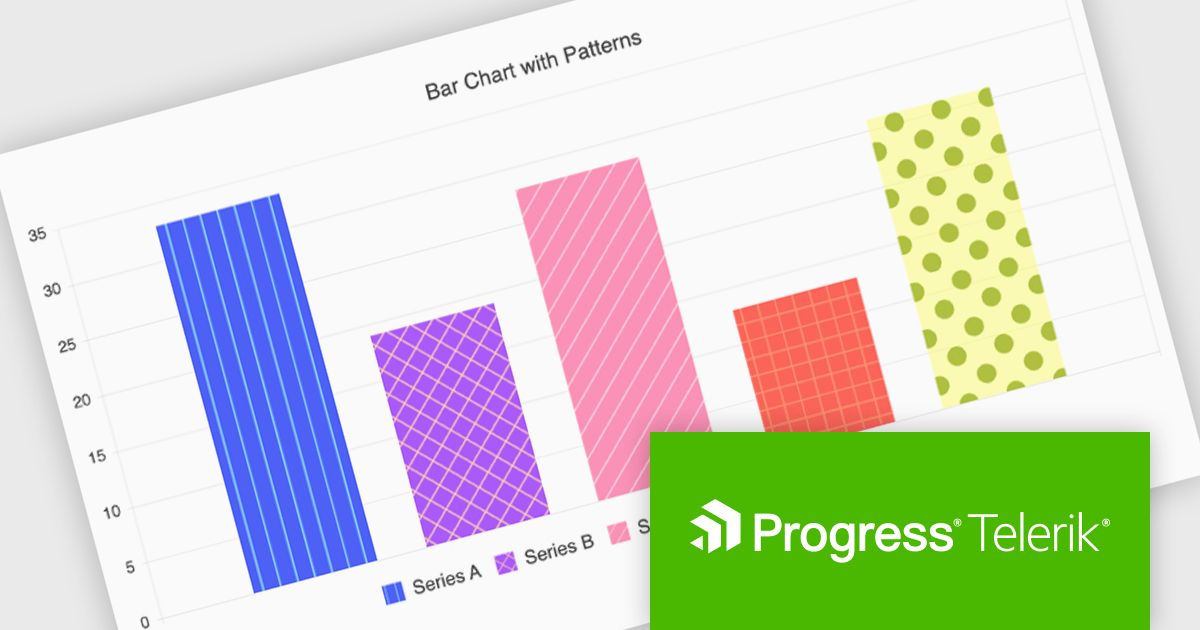
The Kendo UI for Angular v17.1.0 release (part of the 2024 Q4 update) introduces flexible pattern designs for chart series, allowing developers to create visually distinctive and accessible data visualizations. By providing an alternative to solid colors, patterns such as stripes, dots, or grids improve clarity in charts, especially for users with color vision deficiencies or when detailed data differentiation is needed. This feature enables developers to align visualizations with branding guidelines or specific design needs while enhancing the overall user experience with more intuitive and inclusive data representations.
To see a full list of what’s new in v17.1.0 (2024 Q4) see our release notes.
Kendo UI is licensed per developer and is available as a perpetual license with a 1 year support subscription, which is available in 3 tiers: Lite, Priority or Ultimate. See our Kendo UI licensing page for full details.
Kendo UI is also available to buy individually or as part of:
전화 : 00798 14 800 6332
팩스 : +1 770 250 6199


