


공식 공급 업체
200 이상의 소프트웨어 개발처와 판매 계약을 맺은 공인 디스트리뷰터로서 합법적인 라이선스를 제공합니다.
모든 브랜드 보기.
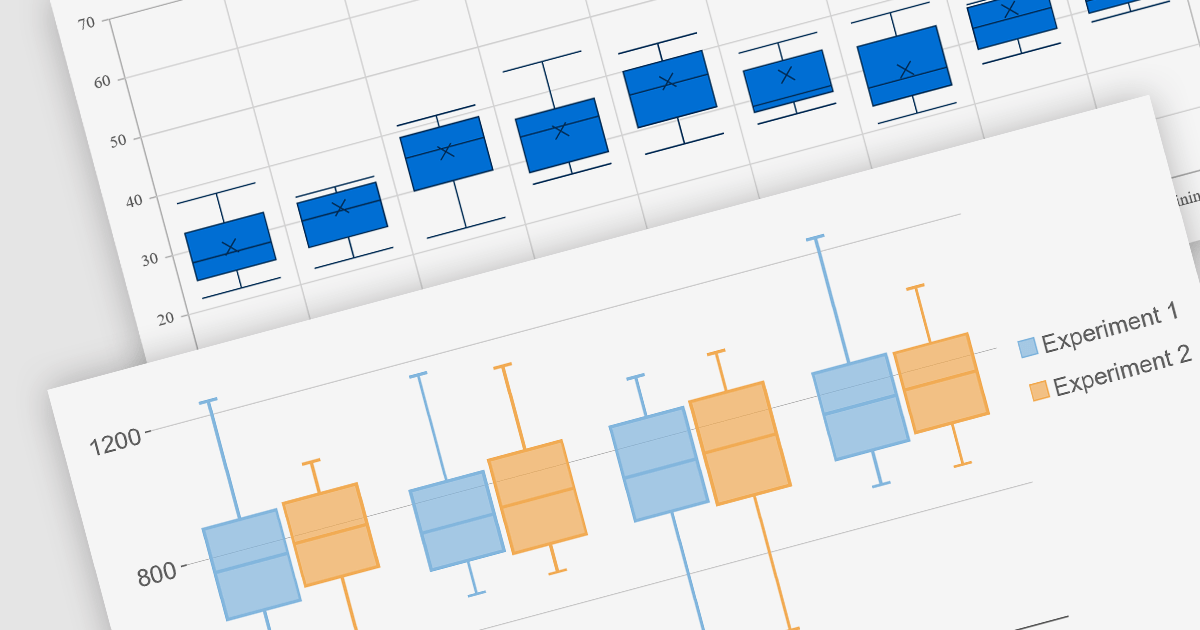
Box plots, also known as box-and-whisker plots, are used to display the distribution of a dataset. They show the median, quartiles, and extremes of the data, providing a quick visual summary of the data's central tendency and variability. This makes them particularly useful for statistical analysis and comparing data across categories.
Several Blazor chart controls offer Box plots including:
For an in-depth analysis of features and price, visit our Blazor chart controls comparison.
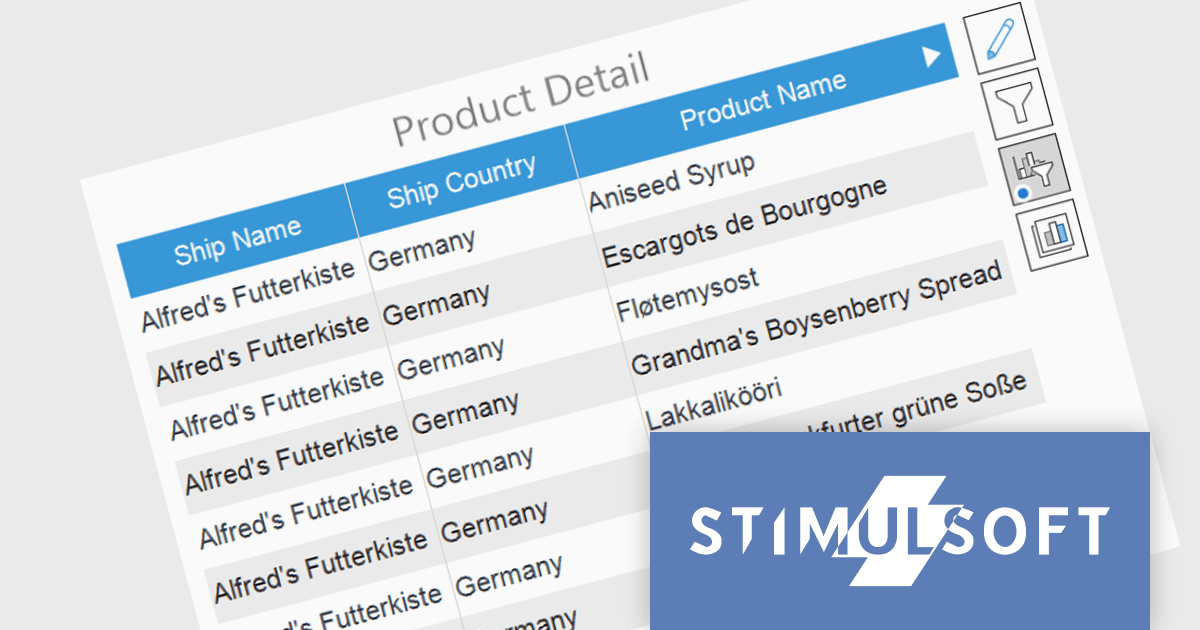
Stimulsoft Dashboards is a versatile suite of tools for crafting interactive data visualizations for web and desktop applications. It empowers developers to embed intuitive dashboards across various platforms, including .NET, JavaScript, and PHP, using the platform-specific components or a centralized cloud designer. With rich data analysis elements, extensive customization options, and pre-built templates, Stimulsoft Dashboards helps you transform complex data into clear, actionable insights for any audience.
The Stimulsoft Dashboards 2024.1.1 update adds the option to include custom filters for the Table element in dashboards. When filters are applied to the table, a dedicated control element lets you easily edit and remove user filters with a single click. This intuitive addition streamlines workflow, keeps you focused, and ensures your dashboards always reflect the exact insights you need.
To see a full list of what's new in version 2024.1.1, see our release notes.
Stimulsoft Ultimate is licensed per developer and is available as a Perpetual license with 1 year support and maintenance. See our Stimulsoft Ultimate licensing page for full details.
Stimulsoft Dashboards is available to buy in the following products:
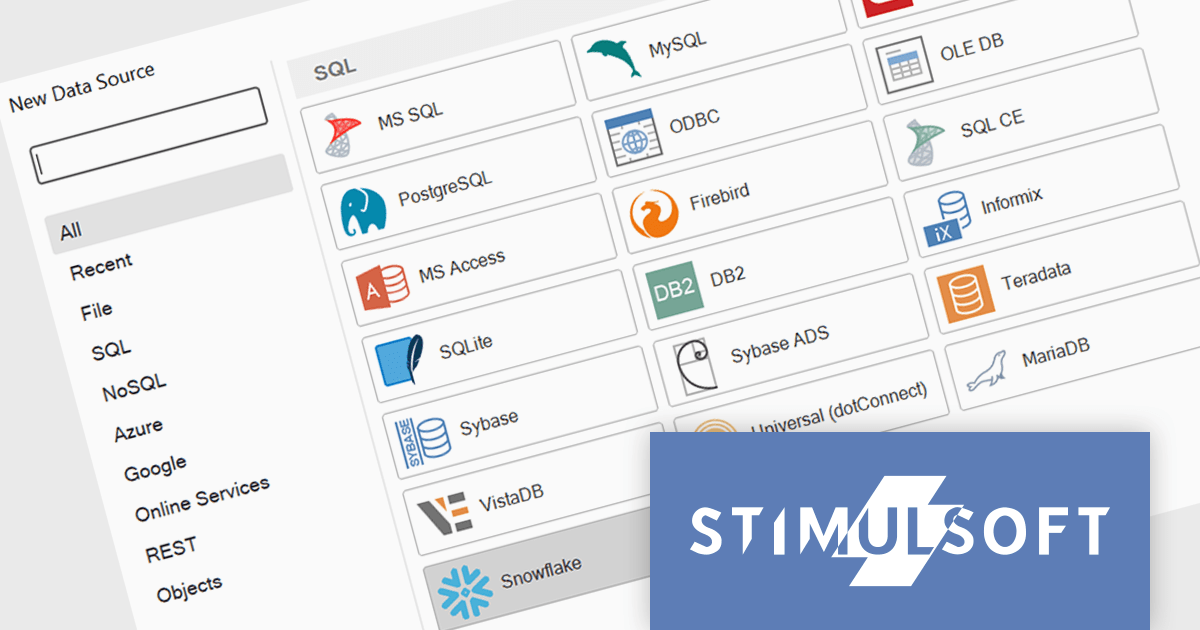
Stimulsoft Reports is a versatile reporting tool that lets you create and generate reports of any complexity from scratch, whether for desktop, web, or mobile platforms. It provides a visual designer and royalty-free runtime that integrates seamlessly with various frameworks like ASP.NET, Java, and JavaScript, empowering applications to generate insightful reports with rich features and diverse export options.
The 2024.1.1 release of Stimulsoft Reports adds a new data adapter for Snowflake, a widely used cloud data storage services, adept at handling both semi-structured and structured data. Developers can now utilize Stimulsoft's robust reporting capabilities to analyze Snowflake data directly, eliminating the need for manual data extraction or intermediary tools. This translates to faster report generation, improved data accuracy, and seamless integration with Snowflake's powerful cloud storage and performance.
To see a full list of what's new in version 2024.1.1, see our release notes.
Stimulsoft Ultimate is licensed per developer and is available as a Perpetual license with 1 year support and maintenance. See our Stimulsoft Ultimate licensing page for full details.
Stimulsoft Reports is available to buy in the following products:
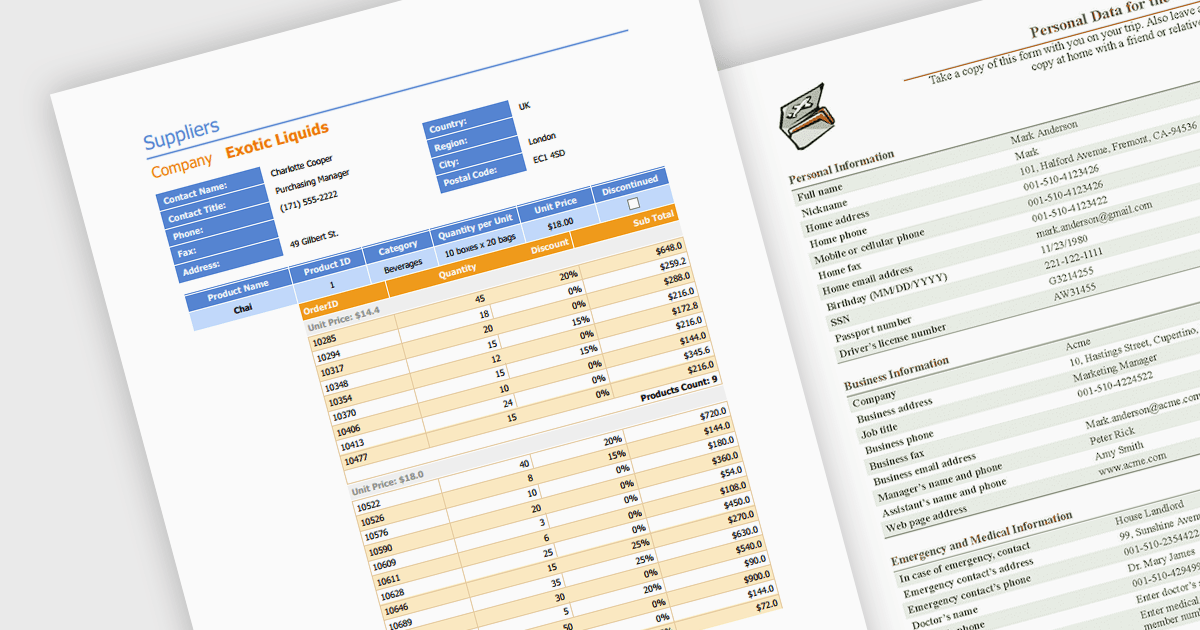
Editing PDFs programmatically allows developers to transcend manual manipulation and embrace code-driven control. By leveraging dedicated libraries and C#, applications can now extract data, update content, and dynamically generate complex documents, all without user intervention. This unlocks profound efficiency gains, automates repetitive tasks, and empowers developers to integrate sophisticated document automation directly into their .NET workflows.
Several .NET components support programmatic editing of PDFs including:
For an in-depth analysis of features and price, visit our .NET PDF Components comparison.
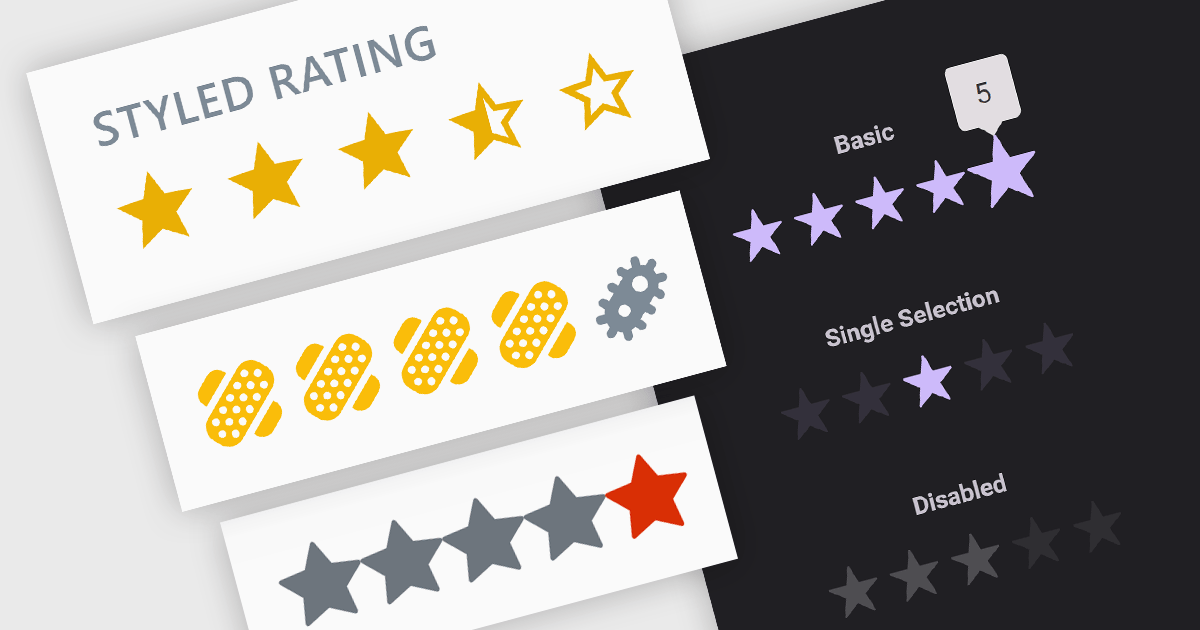
Rating controls are interactive tools used to measure user satisfaction with content, services, or specific features. They allow users to visually convey their opinions through scales, stars, or other predefined metrics. These systems often display average ratings alongside individual selections, providing valuable insights for improvement and personalized user experiences. Rating controls serve as a bridge between users and creators, fostering dialogue and informing data-driven decisions.
Several Blazor data editor collections provide rating controls including:
For an in-depth analysis of features and price, visit our Blazor Data Editors comparison.
전화 : 00798 14 800 6332
팩스 : +1 770 250 6199


