


공식 공급 업체
200 이상의 소프트웨어 개발처와 판매 계약을 맺은 공인 디스트리뷰터로서 합법적인 라이선스를 제공합니다.
모든 브랜드 보기.
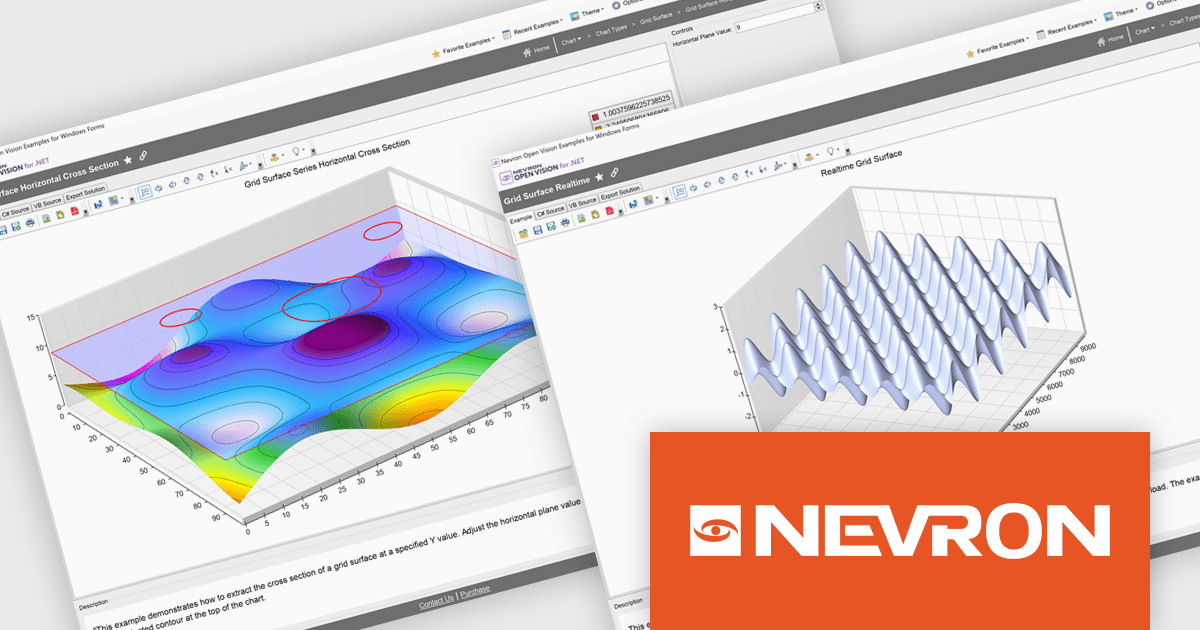
Nevron Open Vision for .NET is a comprehensive cross-platform framework that enables developers to build rich presentation layers from a single codebase supporting Windows, macOS, Android and iOS. It offers an extensive collection of widgets and components including data grids, charting and diagramming so development teams can create modern interfaces without HTML constraints. With built-in virtualization and integration into existing .NET projects, NOV improves development and deployment through single-file executables and reduced boilerplate, making it suitable for enterprise desktop applications, mobile apps and embedded solutions requiring premium-quality UI components.
The Nevron Open Vision for .NET 2025.1 update brings native .NET 9.0 support, enabling developers to leverage the latest runtime improvements for faster startup, reduced memory usage and more efficient garbage collection. By targeting .NET 9.0, NOV components can directly use updated language APIs and benefit from JIT/AOT optimizations without relying on compatibility layers, while still remaining functional on .NET 8.0 and .NET Framework 4.7.2+. This ensures seamless integration with modern tooling in Visual Studio and the .NET CLI, delivers up-to-date security and ultimately allows teams to build and deploy cross-platform applications with greater performance and reliability.
To see a full list of what's new in 2025.1, see our release notes.
Nevron Open Vision for .NET is licensed per developer on a perpetual basis with an optional 12-month subscription for updates and maintenance, and is royalty-free at runtime. See our Nevron Open Vision for .NET licensing page for full details.
For more information, see our Nevron Open Vision for .NET product page.
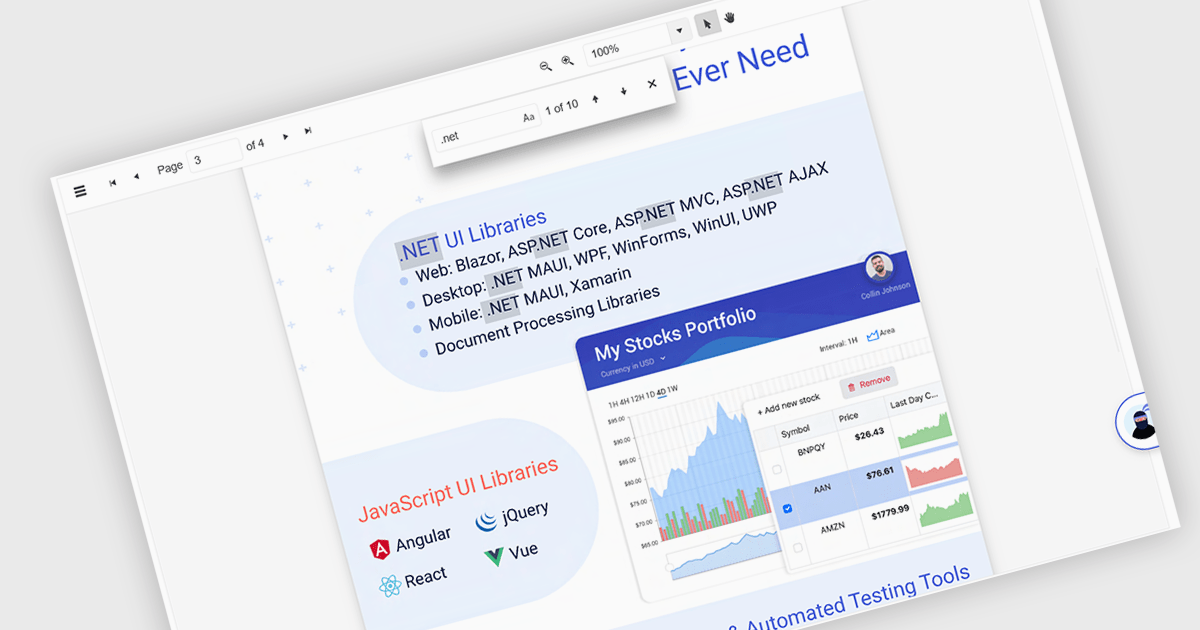
Text Searching in a PDF Viewer .NET Blazor component enables users to locate specific words, terms or phrases within a PDF document. This capability enhances document navigation and accessibility by enabling users to quickly identify and move to relevant content without manually scanning each page. Typically supporting case-sensitive and whole-word matching options, the search can be triggered through UI controls and backend logic, making it a flexible feature for applications that handle large or complex PDF files. This is particularly beneficial for developers building document-heavy applications, as it improves user efficiency and ensures precise content discovery.
Several Blazor PDF Viewers allow users to search for text, including:
For an in-depth analysis of features and price, visit our comparison of Blazor PDF viewers.
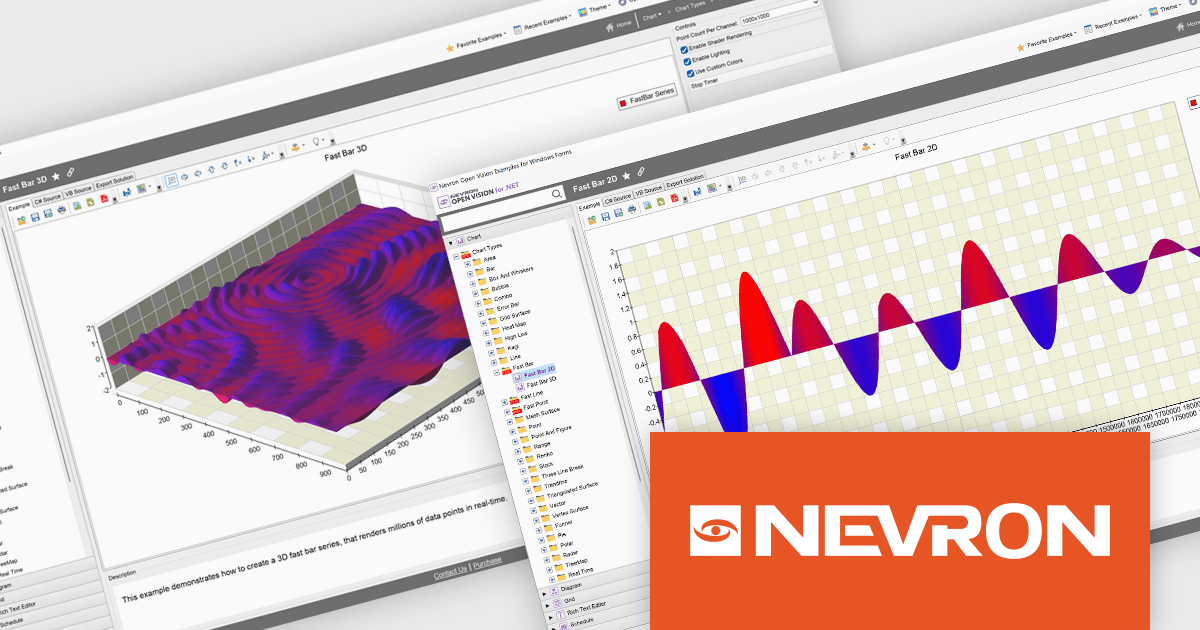
NOV Chart for .NET by Nevron is a comprehensive .NET charting component suite designed for cross-platform application development. It offers an array of 2D and 3D chart types, along with smart data labeling, an advanced chart axes model, numerous interactivity features and GPU-accelerated real-time rendering based on OpenGL. This library allows developers to seamlessly integrate rich, dynamic and interactive business, scientific, financial and presentation data visualizations into their .NET applications for more effective communication.
The NOV Chart for .NET 2025.1 update introduces Fast Bar, Fast Line, and Fast Point series that leverage GPU acceleration to deliver real-time visualization of extremely large datasets, enabling developers to render millions of data points with minimal latency in both 2D and 3D contexts and apply per-point color information for detailed analysis. By offloading heavy rendering tasks to the GPU, these new series reduce CPU overhead and free resources for other application logic, making them particularly valuable in scientific, engineering, and medical scenarios where high-throughput data streams must be displayed without delay.
To see a full list of what's new in 2025.1, see our release notes.
NOV Chart for .NET is licensed per developer and is available as a perpetual license with 1 year support and maintenance. See our NOV Chart for .NET licensing page for full details.
NOV Chart for .NET is available in the following products:
DevCraft by Telerik is a comprehensive suite of more than 1,250 UI components and development tools designed for building modern web, desktop, and mobile applications using .NET and JavaScript frameworks. It includes reporting and report management solutions, automated testing and mocking tools, and document processing libraries, as well as a wide range of professionally designed user interface controls from the Telerik and Kendo UI suites. DevCraft enables developers to create feature-rich, high-performance applications with consistent design and user experience, delivering enterprise-level, scalable, and maintainable software solutions.
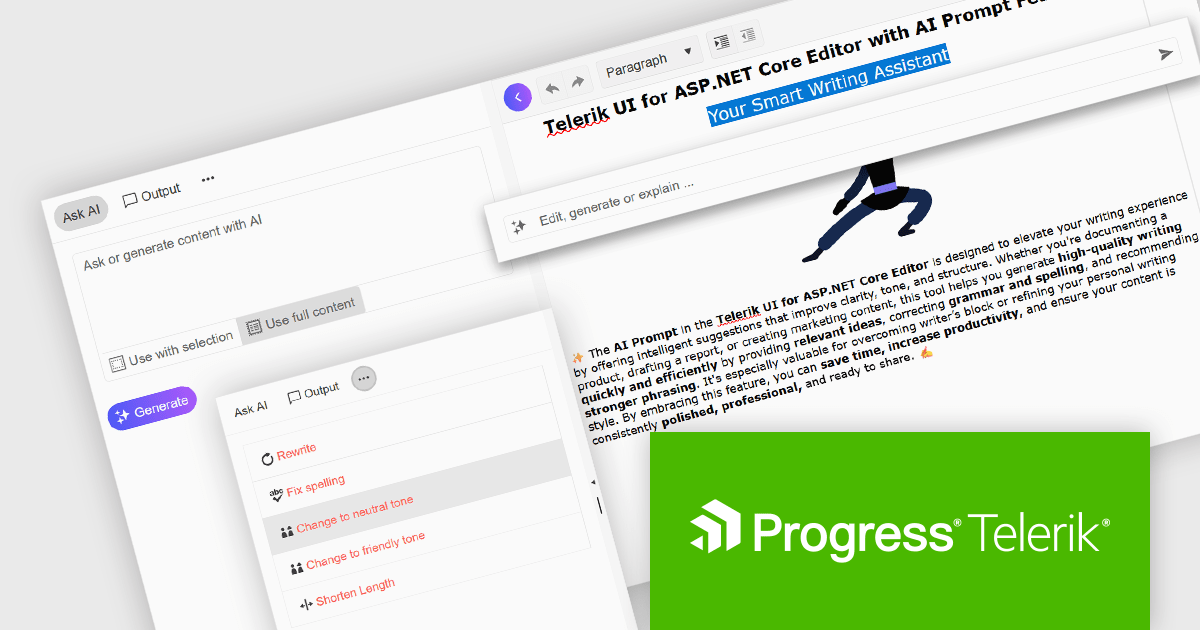
The Telerik DevCraft 2025 Q2 update adds an AI Prompt helper to the Editor control in Blazor, ASP.NET Core/MVC and jQuery, integrating AI-assisted content editing directly into the user interface. This feature provides both inline and side-panel interactions, allowing users to perform tasks such as grammar correction, tone adjustment, text rewriting, and translation without leaving the editor. By leveraging context-aware AI capabilities, the content creation and editing processes become much simpler, enabling developers to deliver more refined and effective user experiences within their applications.
To see what else is new in 2025 Q2, see our release notes.
Telerik DevCraft is licensed per developer and has two licensing models: an annual Subscription License and a Perpetual License. The Subscription license provides access to the latest product updates, technical support, and exclusive benefits for a flat annual fee, and must be renewed to continue using the software. The Perpetual license is a one-time purchase granting access to the current released version and includes a one-year subscription for product updates and technical support. After this initial period, users can choose to renew the subscription element to continue receiving updates and support; otherwise, they may continue using the installed version available during their active subscription term but will forgo future updates and support. See our Telerik DevCraft Ultimate licensing page for full details.
Telerik DevCraft is available in the following editions:
Since 2022, ComponentSource has expanded global access to Blazorise’s high performance UI component library by offering it through their comprehensive catalog of developer tools. Blazorise’s modular architecture and seamless integration with Bootstrap, Bulma, AntDesign and Material perfectly complement ComponentSource’s mission to provide versatile, high-quality components for any project.
Over the past three years, this partnership has demonstrated a shared commitment to delivering feature rich Blazor UI solutions including theming, form validation, localization, data grids and charting that integrate seamlessly into modern web applications.
As they mark three years of working together, ComponentSource and Blazorise continue to support developers with a growing ecosystem of modern UI components, proactive feature enhancements, comprehensive documentation, and expert support that accelerate Blazor application development.
Blazorise is licensed per developer and is runtime royalty free. Licenses include a 1 year subscription for updates and premium support. Professional, Enterprise, and Enterprise Plus editions are available, each offering tailored levels of support and service to meet varying business needs. See our Blazorise licensing page for full details.
For more information, visit our Blazorise brand page.
전화 : 00798 14 800 6332
팩스 : +1 770 250 6199


