













공식 공급 업체
200 이상의 소프트웨어 개발처와 판매 계약을 맺은 공인 디스트리뷰터로서 합법적인 라이선스를 제공합니다.
모든 브랜드 보기.
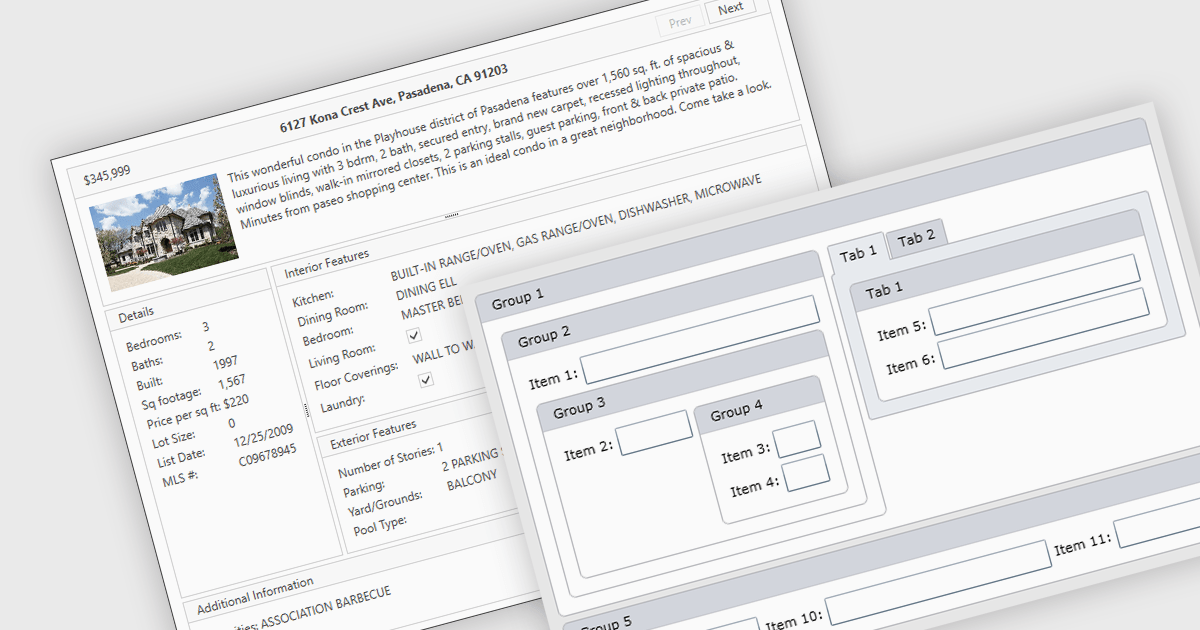
Layout components are reusable building blocks that define the structure and arrangement of content within a user interface. They encapsulate layout logic such as grid systems, promoting code reusability, consistency, and maintainability. By abstracting layout, these components enhance development efficiency and improve the overall design cohesion of an application.
Several WPF UI suites offer layout components including:
For an in-depth analysis of features and price, visit our WPF UI suites comparison.
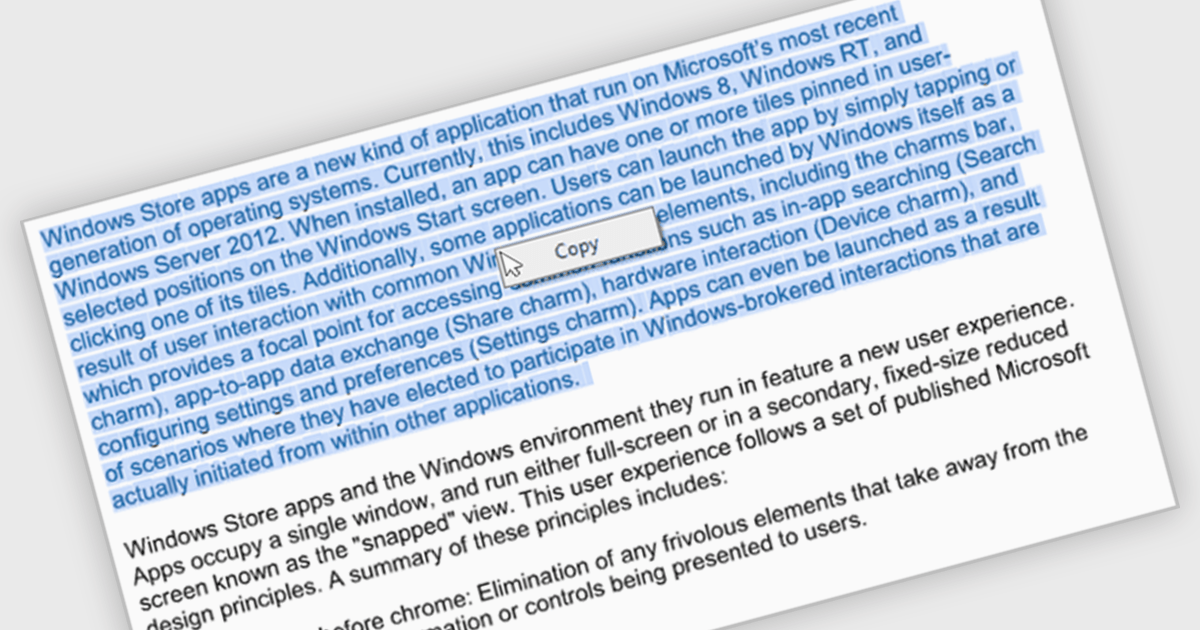
The ability to select and copy text empowers users to easily extract information from documents for pasting into other applications or sharing snippets. This not only saves time and reduces errors during data transfer but also broadens the utility of PDFs by making them more compatible with various workflows, such as research note-taking, quote extraction for proposals, or incorporating text into presentations.
Several .NET WinForms PDF viewer components include the ability to select and copy text in PDFs including:
For an in-depth analysis of features and price, visit our .NET WinForms PDF viewer components comparison.
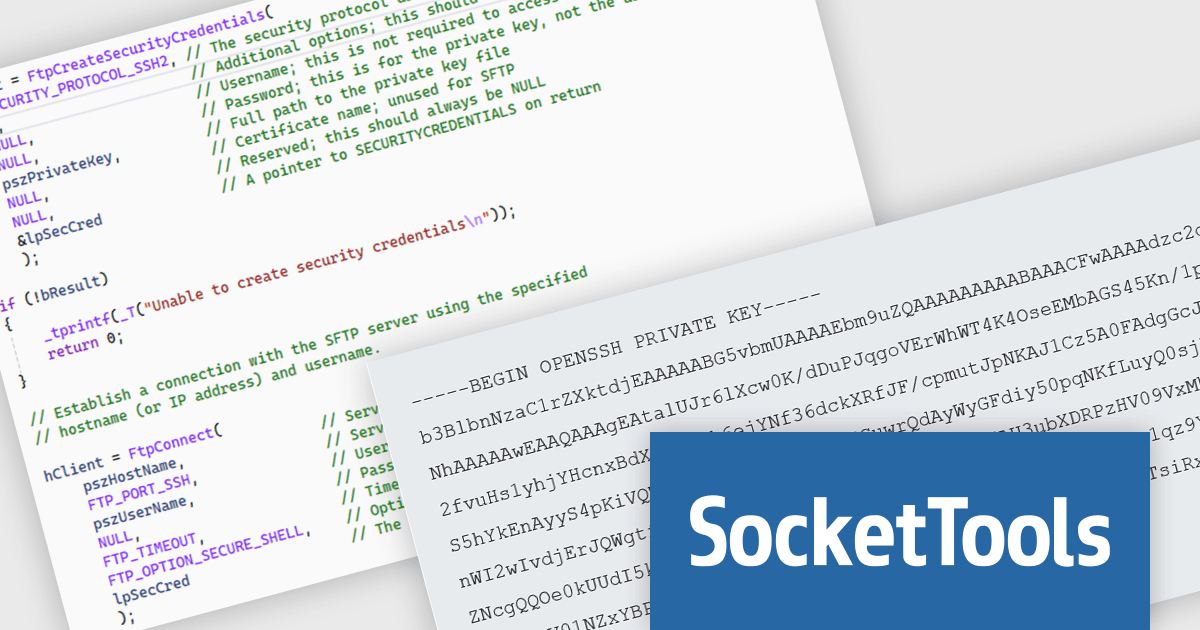
SocketTools .NET Edition by Catalyst Development Corp. is a development library designed to simplify adding internet functionality to your C# or Visual Basic applications. It provides managed .NET classes for tasks like file transfer, email communication, remote server management, and secure connections via TLS and SSH. The library offers private cloud storage and IP location lookup, eliminating the need for additional subscriptions or services.
The SocketTools .NET Edition 11.0.2194.1712 release introduces public/private key authentication for SSH and SFTP, significantly improving security for server access within your applications. This eliminates the risk associated with storing passwords and simplifies key management for automated tasks, providing a more robust and user-friendly approach.
To see a full list of what's new in version 11.0.2194.1712, see our release notes.
SocketTools .NET Edition is licensed per developer and is available as a Perpetual License with or without 1 Year Priority Support subscription. See our SocketTools .NET Edition licensing page for full details.
SocketTools .NET Edition is available to buy in the following products:
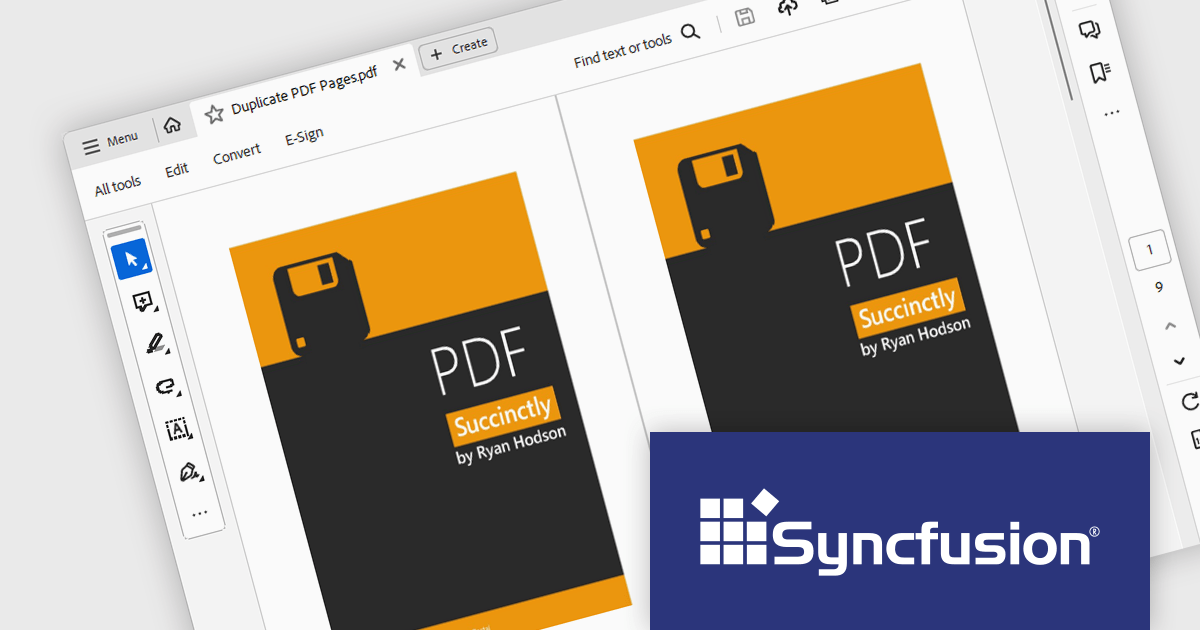
Syncfusion Essential Studio Windows Forms is a powerful UI component suite designed to enhance your WinForms development. It boasts over 100 high-performance controls, ranging from essential grids and charts to advanced schedulers and diagrams, enabling you to craft visually appealing and feature-rich applications with ease. Its extensive customization options and built-in themes allow for tailored user experiences, while touch-friendly design ensures seamless interaction across devices.
The Syncfusion Essential Studio Windows Forms 2024 Volume 2 (26.1.35) release allows users to duplicate pages within the same PDF document, facilitating easier content replication and organization. This support is useful for quickly creating templates, maintaining consistency across multiple sections, and streamlining document editing processes.
To see a full list of what's new in 2024 Volume 2 (26.1.35), see our release notes.
Syncfusion Essential Studio Windows Forms is available as part of Syncfusion Essential Studio Enterprise which is licensed per developer starting with a Team License of up to five developers. It is available as a 12 Month Timed Subscription License which includes support and maintenance. See our Syncfusion Essential Studio Enterprise licensing page for full details.
Learn more on our Syncfusion Essential Studio Windows Forms product page.

DevExpress BI Dashboard (part of DevExpress Universal) empowers you to craft interactive dashboards for desktop, web and mobile applications. It provides a visual designer for building dashboards without writing code, allowing you to drag-and-drop various data visualization widgets onto the canvas. These widgets connect to your data sources and update dynamically, offering real-time insights to end users. The tool also supports customization through properties and events, enabling you to tailor the look and feel of the dashboards to perfectly integrate with your application's design.
The DevExpress BI Dashboard 24.1 release adds support for cascading parameters. This powerful feature allows you to create intuitive filter hierarchies within your dashboards. Imagine selecting a value in a parent parameter, then watching as the options in a dependent parameter automatically update to reflect the chosen filter. This eliminates the need for users to manually navigate through potentially overwhelming dropdown lists, fostering a more focused and efficient experience. Cascading parameters empower you to design dashboards that guide users towards deeper insights within your data.
To see a full list of what's new in version 24.1, see our release notes.
DevExpress BI Dashboard is included as part of DevExpress Universal which is licensed per developer and is available as a Perpetual License with a 12 month support and maintenance subscription. See our DevExpress Universal licensing page for full details.
DevExpress BI Dashboard is available in the following products:
전화 : 00798 14 800 6332
팩스 : +1 770 250 6199


