


공식 공급 업체
200 이상의 소프트웨어 개발처와 판매 계약을 맺은 공인 디스트리뷰터로서 합법적인 라이선스를 제공합니다.
모든 브랜드 보기.
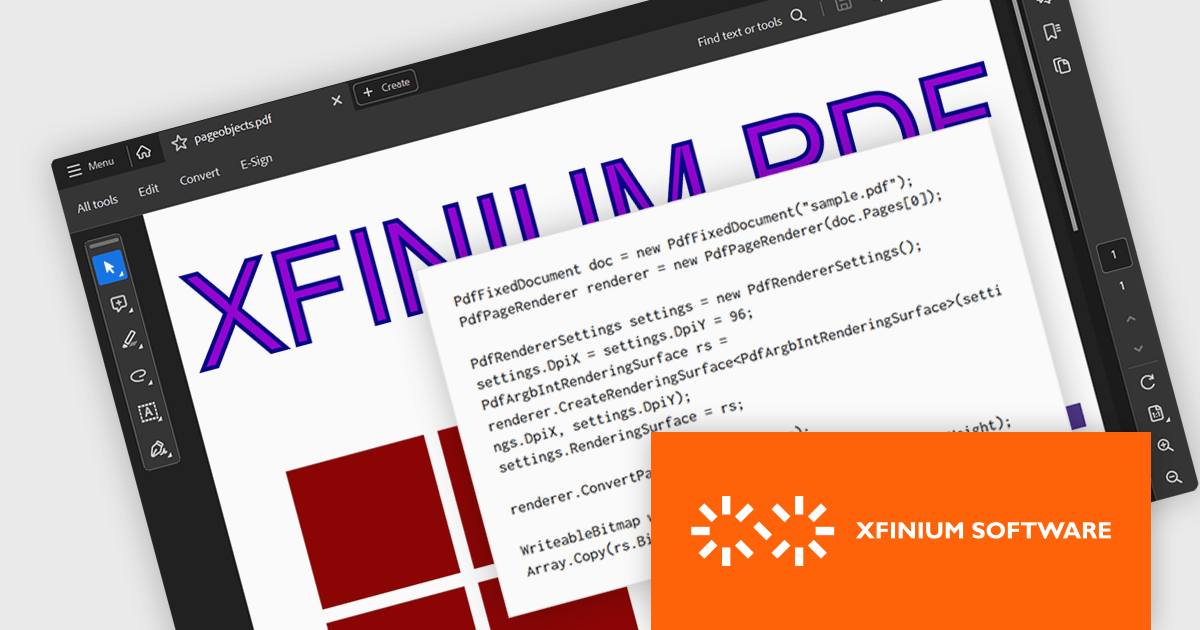
XFINIUM.PDF CROSS-PLATFORM BUNDLE is a software library that allows developers to create applications that can work with PDF files on a variety of platforms, including Windows, Mac, mobile devices (iOS and Android), and web applications. This means developers can write code once and deploy their PDF functionality across different environments without needing to rewrite for each platform.
The XFINIUM.PDF CROSS-PLATFORM BUNDLE V13.0 release adds support for multi-threaded PDF to image conversion. By utilizing multiple threads, the software can convert PDF files to images much faster compared to single-threaded processing. This can be especially advantageous when converting large or complex PDFs.
To see a full list of what's new in version 13.0.0, see our release notes.
XFINIUM.PDF CROSS-PLATFORM BUNDLE is licensed per developer and is run-time royalty free. All licenses include a 12 month subscription which provides all major and minor product updates and technical support. See our XFINIUM.PDF CROSS-PLATFORM BUNDLE licensing page for full details.
For more information, visit our XFINIUM.PDF CROSS-PLATFORM BUNDLE product page.
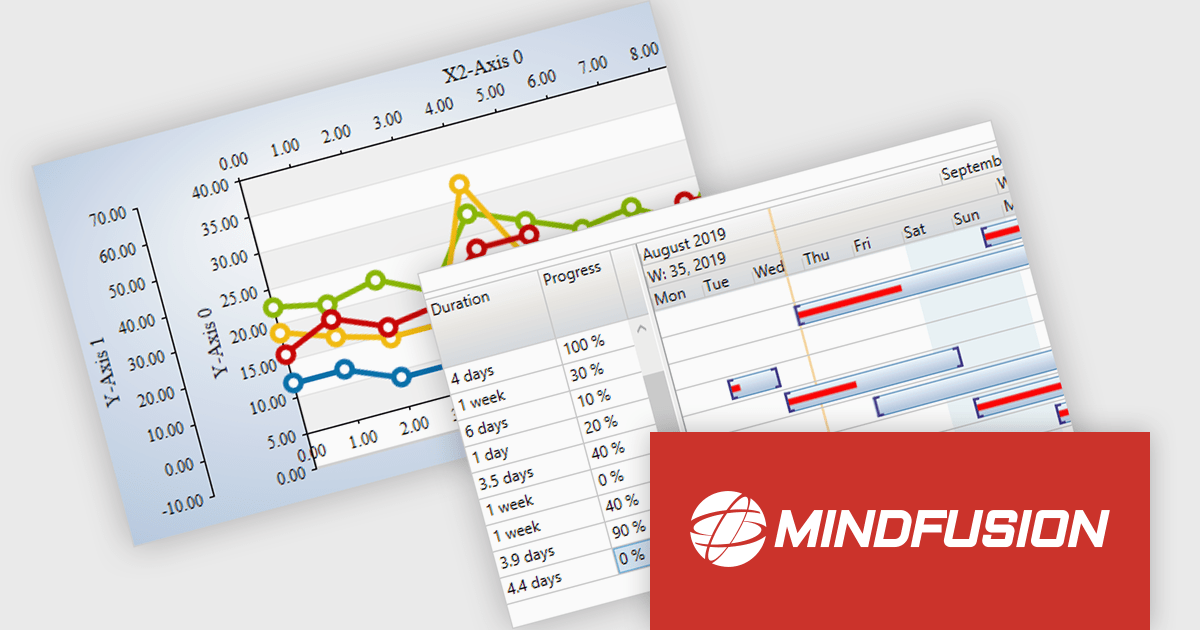
MindFusion.WPF Pack is a collection of UI controls designed to simplify the development of feature-rich WPF applications. It provides components for creating sophisticated diagrams, charts, reports, calendars, and user interfaces, along with tools for scheduling and data visualization. These components are known for their customizability and ease of integration, allowing developers to focus on application logic rather than building these elements from scratch.
The MindFusion.WPF Pack 2024.R1 release empowers developers to build next-generation WPF applications by seamlessly integrating with Microsoft .NET 8.0. This enhanced compatibility unlocks the latest performance optimizations, robust security enhancements, and a wealth of new features within the .NET framework. These advancements empower developers to deliver applications that offer high performance, robust security, and a seamless user experience.
To see a full list of what's new in version 2024.R1, see our release notes.
MindFusion.WPF Pack is licensed per developer and is available as a perpetual license with 1 year subscription and support. See our MindFusion.WPF Pack licensing page for full details.
For more information, visit our MindFusion.WPF Pack product page.
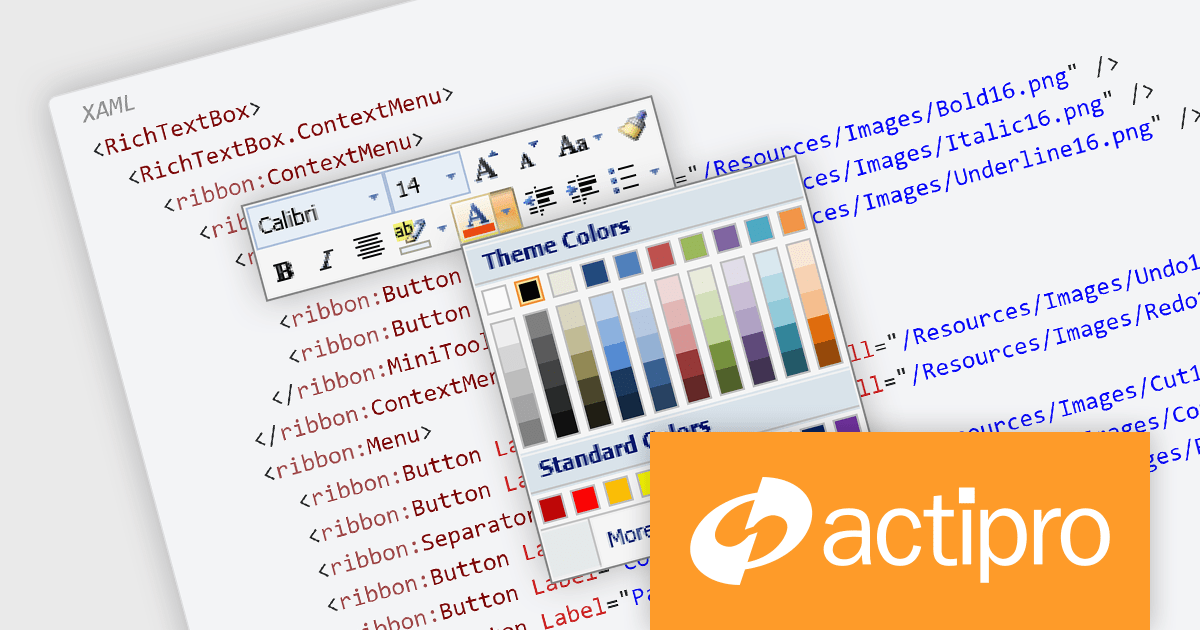
Actipro Bars for WPF is a UI component library that equips developers with the tools to build advanced ribbons, toolbars, and menus within their WPF applications. It offers an "Office-like" ribbon experience with customization options, supports MVVM design patterns, and includes a rich set of controls specifically designed for use within these elements, allowing for a cohesive and user-friendly interface.
The Actipro Bars for WPF V24.1.1 release introduces the MiniToolBar, a new control designed to improve user experience and productivity. This context-sensitive toolbar appears next to highlighted text or alongside context menus, offering quick access to relevant formatting and editing functions. By eliminating the need to navigate through text-based menus or cluttered toolbars, the MiniToolBar streamlines workflows and keeps the workspace clean, allowing users to focus on completing tasks efficiently.
To see a full list of what's new in 24.1.1, see our release notes.
Actipro Bars for WPF is licensed per developer and is available as a Perpetual license with 1 year support and maintenance. See our Actipro Bars for WPF licensing page for full details.
Actipro Bars for WPF is available in the following products:
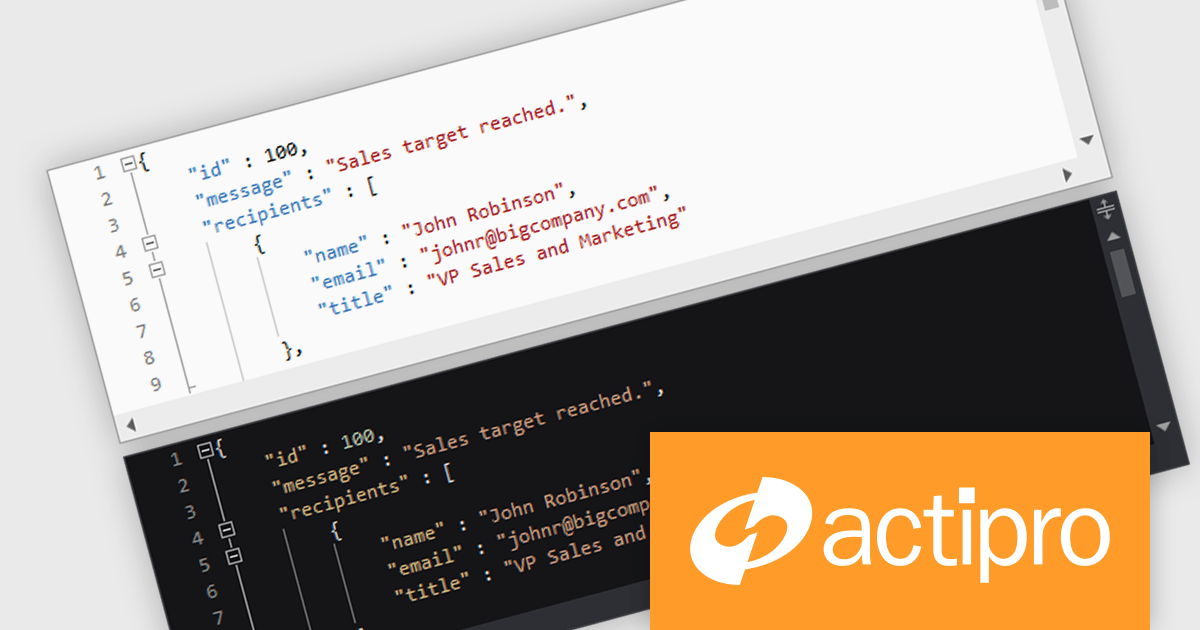
Actipro SyntaxEditor is a sophisticated WPF code editor control designed to provide developers with a seamless way to integrate advanced code editing capabilities into their .NET applications. It offers syntax highlighting for numerous programming languages, code outlining, automated IntelliPrompt (code completion and information tooltips), background parsing, error reporting, and more. This delivers a familiar user experience for developers used to the powerful code editors found in popular IDEs.
The Actipro SyntaxEditor v24.1 release streamlines light and dark theme switching with a dedicated class to manage UI elements, highlighting styles, and icon sets during theme transitions. All built-in syntax languages come with both light and dark highlighting styles, and for custom languages that lack dedicated dark styles, SyntaxEditor automatically converts many common light-themed colors to suitable dark theme equivalents. This comprehensive approach ensures a smooth and visually consistent user experience regardless of the chosen theme.
To see a full list of what's new, see our Actipro SyntaxEditor for WinForms release notes or our Actipro SyntaxEditor for WPF release notes.
Actipro SyntaxEditor is licensed per developer and is available as a Perpetual license with 1 year support and maintenance. See our Actipro SyntaxEditor for WinForms licensing page or our Actipro SyntaxEditor for WPF licensing page for full details.
Learn more on our Actipro SyntaxEditor for WinForms and Actipro SyntaxEditor for WPF product pages.
ActiveReports.NET is a reporting tool that allows developers to design and deliver reports with intuitive, reliable, and user-friendly report designers and controls. Features include the ability to create reports in a variety of formats, such as PDF, Excel, and HTML. ActiveReports.NET is also highly customizable, with an extensive API and advanced feature library.
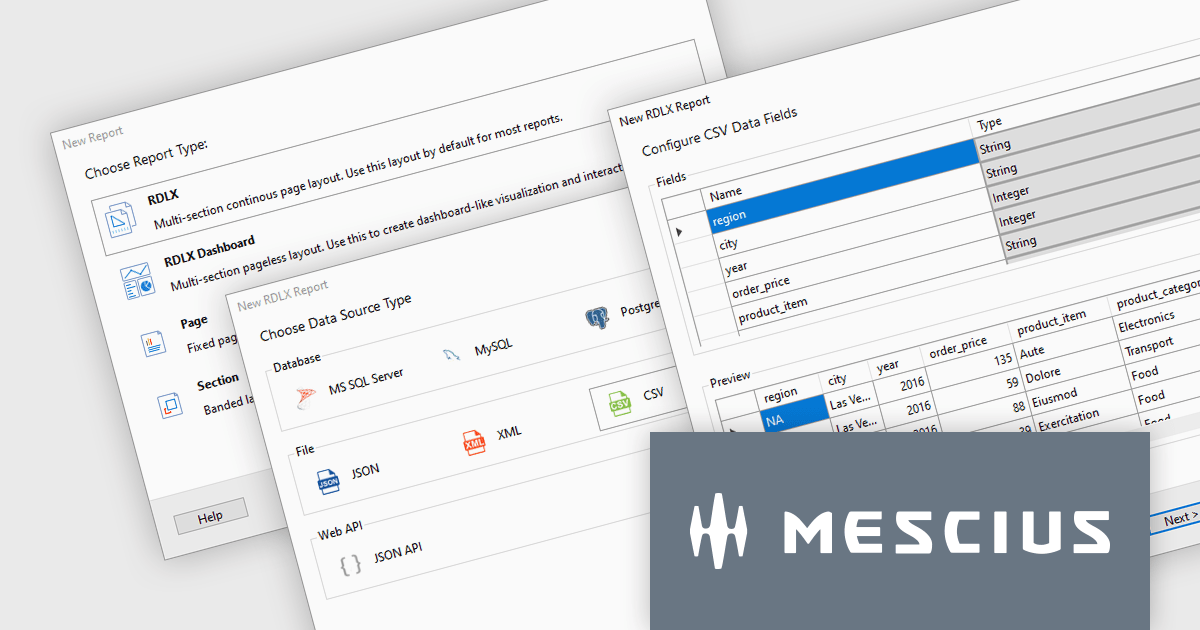
ActiveReports.NET v18 introduces a powerful Report Wizard to streamline the creation of RDLX, Page, and Dashboard reports. This intuitive wizard expertly guides you through the entire report design process, from initial configuration to seamless data binding. Whether you're crafting detailed financial reports, visually rich data dashboards, or any other type of document-based presentation, the wizard ensures a smooth experience. This new feature helps you transform raw data into clear, actionable insights with ease.
To see a full list of what's new in version 18, see our release notes.
ActiveReports.NET is licensed per developer and is available with or without a 12 month support and maintenance subscription. See our ActiveReports.NET licensing page for full details.
For more information, visit our ActiveReports.NET product page.
전화 : 00798 14 800 6332
팩스 : +1 770 250 6199


