


공식 공급 업체
200 이상의 소프트웨어 개발처와 판매 계약을 맺은 공인 디스트리뷰터로서 합법적인 라이선스를 제공합니다.
모든 브랜드 보기.
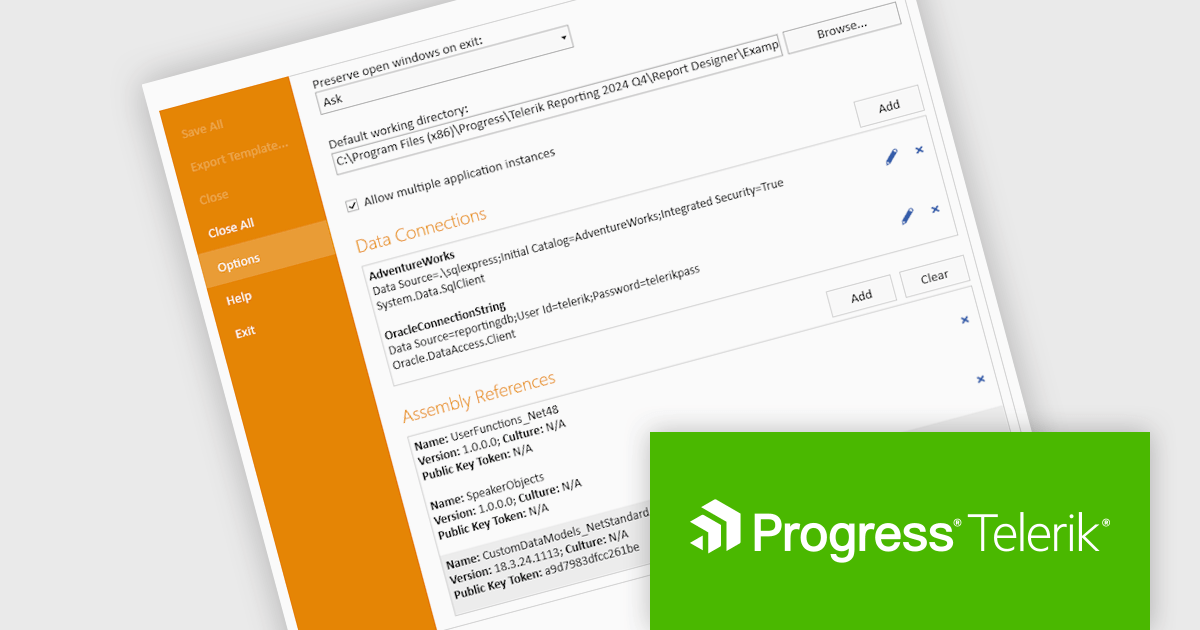
Telerik Reporting is a comprehensive and lightweight embedded reporting tool for .NET web and desktop applications. It enables developers and reporting users to create, design, and export visually appealing, interactive, and reusable reports to effectively present analytical and business data. It supports various technologies, including ASP.NET Core, Blazor, ASP.NET MVC, ASP.NET AJAX, HTML5/JS, Angular, WPF, WinForms, and WinUI.
The Telerik Reporting 2024 Q4 update introduces enhanced Standalone Report Designer tooling, providing developers with a streamlined approach to extending the Standard Report Definition (SRD). This new tooling allows for seamless customization through an intuitive UI, eliminating the need to manually edit configuration files or restart the designer after modifications. By enabling real-time updates and reducing workflow interruptions, this feature enhances development efficiency, minimizes errors, and accelerates iteration cycles, ensuring a more productive and user-friendly reporting experience.
To see a full list of what's new in 2024 Q4 (18.3.24.1112), see our release notes.
Telerik Reporting is licensed per developer and is available as a perpetual license with a one year support subscription, which is offered in three tiers: Lite, Priority or Ultimate. See our Telerik Reporting licensing page for full details.
Telerik Reporting is available to buy in the following products:
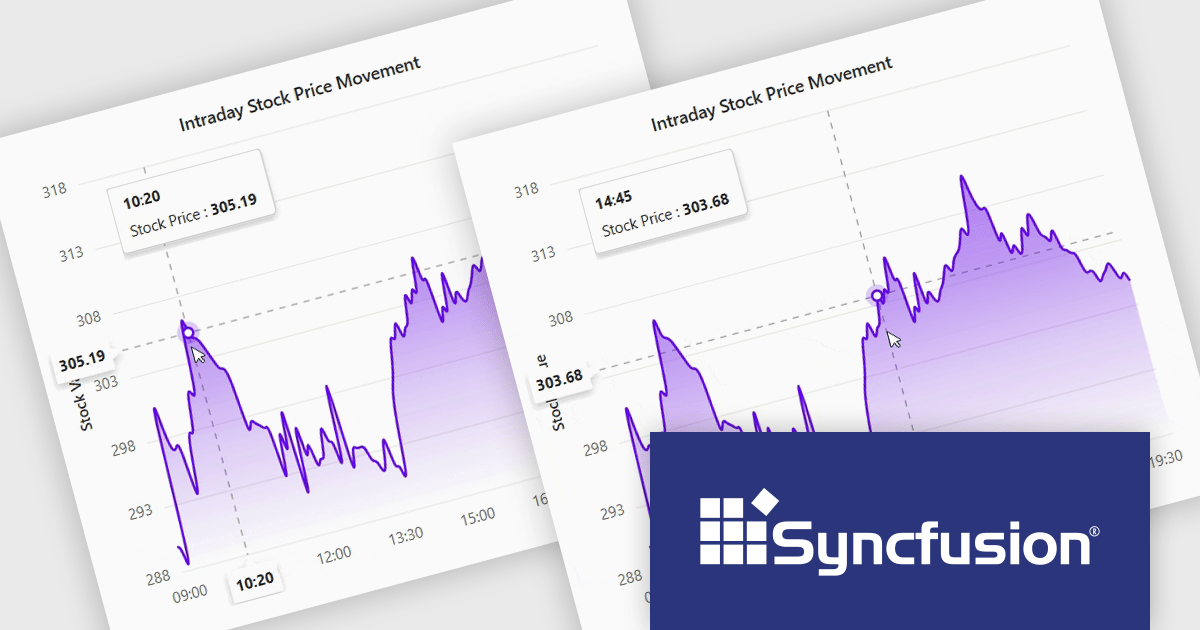
Syncfusion Essential Studio ASP.NET MVC (available as part of Syncfusion Essential Studio Enterprise) is a comprehensive suite of web UI controls that empowers developers to craft rich, interactive ASP.NET MVC applications. Backed by the lightweight and modular Essential JS 2 library, it offers over 80 components ranging from data grids and charts to schedulers and pivot grids, while ensuring a seamless integration with the MVC framework for an efficient development experience.
The Syncfusion Essential Studio ASP.NET MVC 2024 Volume 4 (28.1.33) update introduces the Crosshair Snap feature to its charting tools, delivering enhanced precision and usability for developers. This feature ensures the crosshair automatically snaps to the nearest data point, eliminating the need for users to align the cursor with exact positions manually. By streamlining interaction with charts, the Crosshair Snap simplifies the analysis of complex datasets and improves the clarity of data visualization. This addition not only optimizes the end-user experience but also provides developers with a powerful tool to create more intuitive and efficient applications.
To see a full list of what's new in 2024 Volume 4, see our release notes.
Syncfusion Essential Studio ASP.NET MVC is available as part of Syncfusion Essential Studio Enterprise which is licensed per developer starting with a Team License of up to five developers. It is available as a 12 Month Timed Subscription License which includes support and maintenance. See our Syncfusion Essential Studio Enterprise licensing page for full details.
Learn more on our Syncfusion Essential Studio ASP.NET MVC product page.
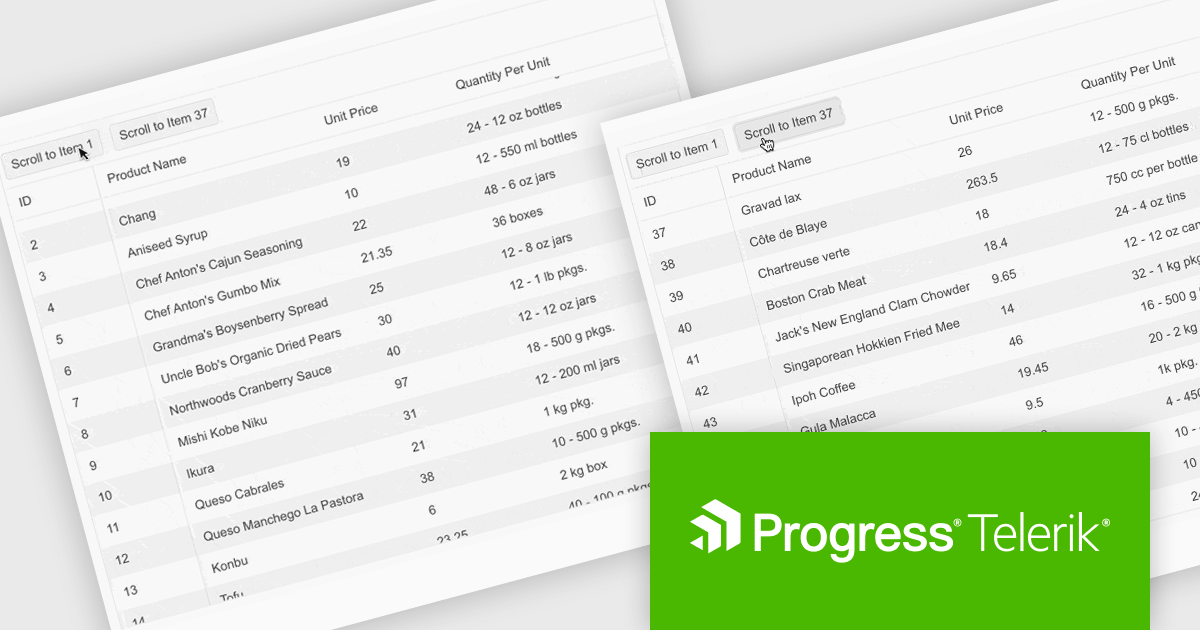
Telerik UI for ASP.NET Core is a robust library of over 110 UI components designed for modern web applications. It offers high performance, scalability, and extensive customization to meet diverse requirements in data handling, UX, design, and accessibility. Key components like the Grid, Scheduler, Chart, and Editor enable intuitive data visualization and manipulation, making it ideal for applications ranging from interactive dashboards to complex enterprise solutions. With Telerik UI for ASP.NET Core, developers can create feature-rich, professional-grade applications with ease.
The Telerik UI for ASP.NET Core 2024 Q4 update introduces the "Scroll to Item" method, a powerful feature designed to streamline navigation within data-intensive grids. This method allows developers to programmatically direct users to specific rows based on their unique identifiers, enhancing usability and reducing the need for manual scrolling. It supports both standard and virtual scrolling scenarios, ensuring seamless performance even when the targeted row is not initially loaded by invoking a callback function to handle data retrieval. By simplifying access to critical data points, the "Scroll to Item" method improves the efficiency of user workflows, making it an essential tool for building intuitive, data-driven applications.
To see a full list of what's new in 2024 Q4, see our release notes.
Telerik UI for ASP.NET Core is licensed per user and is available as an annual license with a one year support subscription, which is available in three tiers: Lite, Priority or Ultimate. See our Telerik UI for ASP.NET Core licensing page for full details.
Telerik UI for ASP.NET Core is available individually or as part of the following products:
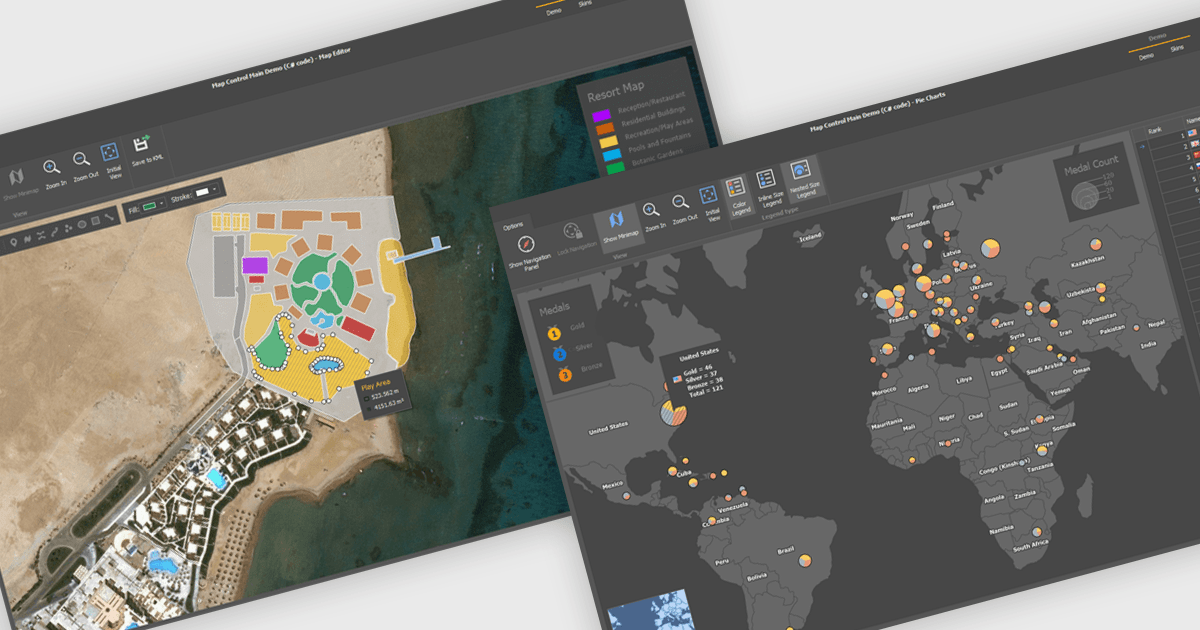
Maps are powerful tools for integrating geographic data and visualizations, enabling users to explore and understand information in a spatial context. With features like zooming, panning, and layering, maps provide an interactive way to analyze data and identify patterns. They support cross-platform compatibility, allowing consistent performance across devices, and can be customized to align with specific branding or design needs.
Several .NET WinForms UI suites offer map components including:
For an in-depth analysis of features and price, visit our comparison of .NET WinForms UI suites.
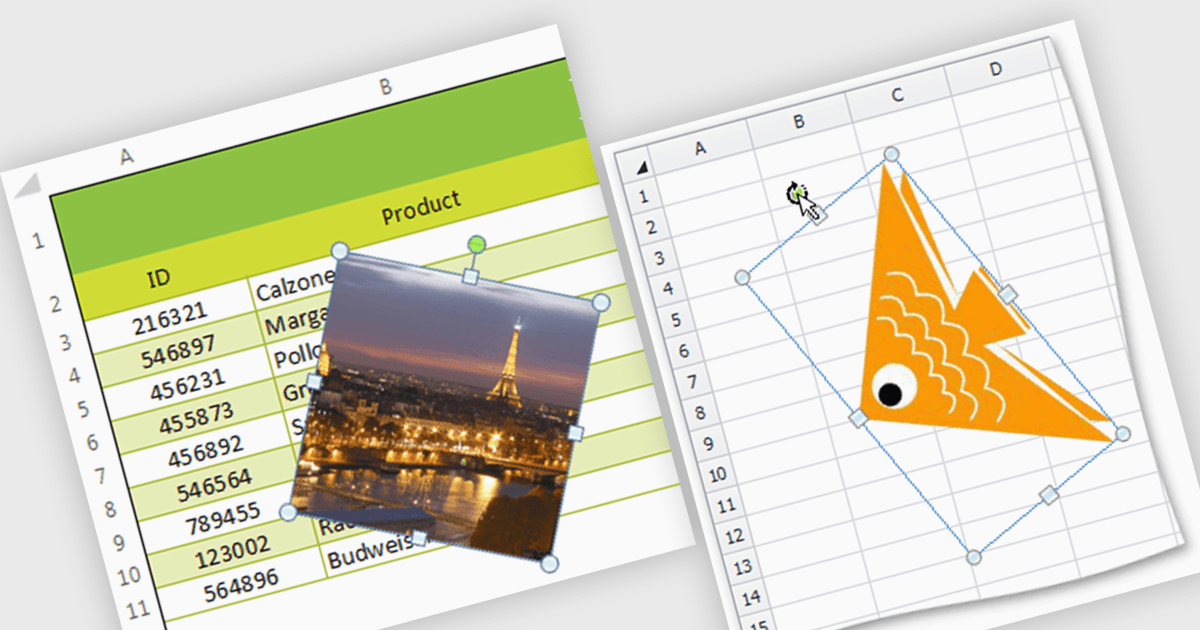
Image support within a spreadsheet component allows developers to seamlessly integrate and manipulate images directly within the spreadsheet environment, enabling features such as inserting, resizing, positioning, and formatting images within cells or as background elements. By embedding images alongside numerical or textual data, users can enhance data visualization, streamline report generation, and provide richer context for decision-making, ultimately improving communication and enabling more effective data analysis within applications.
Several WinForms spreadsheet components support inserting images, including:
For an in-depth analysis of features and price, visit our WinForms spreadsheet controls comparison.
전화 : 00798 14 800 6332
팩스 : +1 770 250 6199


