


공식 공급 업체
200 이상의 소프트웨어 개발처와 판매 계약을 맺은 공인 디스트리뷰터로서 합법적인 라이선스를 제공합니다.
모든 브랜드 보기.
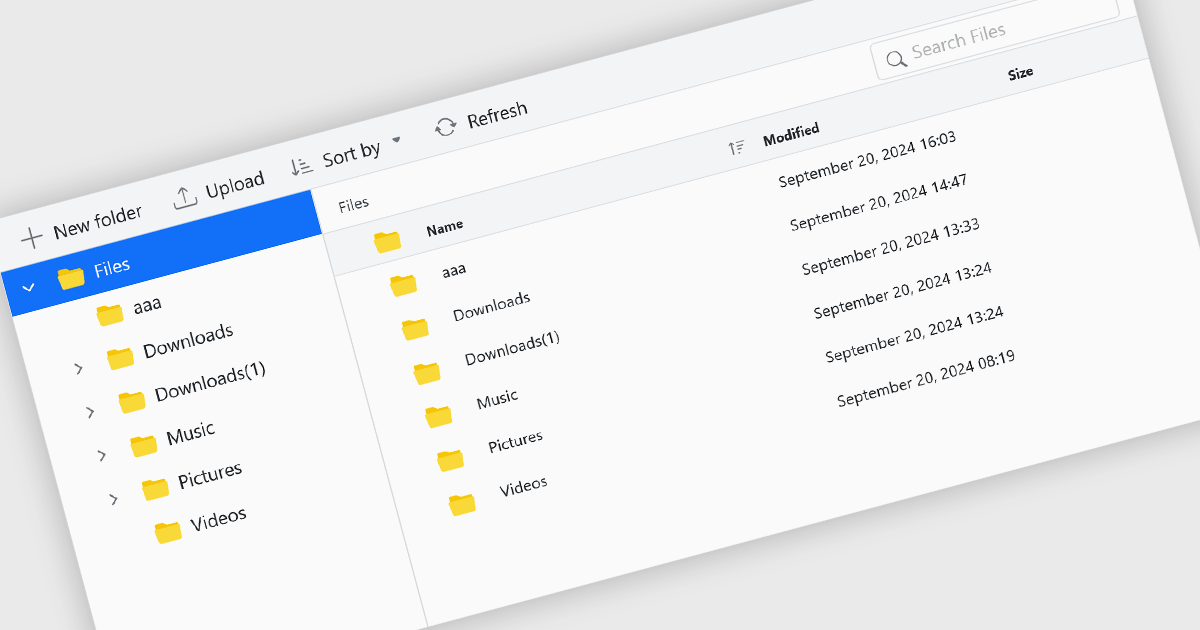
File management components, such as file explorers, uploaders, and downloaders, are essential elements in UI suites as they facilitate seamless interaction with files and data. These components enable users to efficiently organize, access, and manipulate files within an application, enhancing productivity and usability. By providing intuitive and user-friendly interfaces for file operations, these components contribute to a positive and efficient user experience.
Several ASP.NET Core UI suites offer file management controls including:
For an in-depth analysis of features and price, visit our ASP.NET Core UI suites comparison.

Grial UI Kit by UXDivers is a collection of pre-designed user interface components and templates specifically built for Xamarin.Forms and .NET MAUI app development. It offers a wide range of customizable XAML code snippets, custom controls, and helpers, allowing developers to rapidly build modern and visually appealing mobile applications for Android and iOS platforms while focusing on the core functionalities of the app.
The Grial UI Kit 2024.4 release adds a new Task Flow interface which offers three interconnected pages for a comprehensive view of summarized and detailed data, such as employees, tasks, and performance. Though it features employee data by default, it is highly customizable. Thanks to the flexibility of bindings and the MVVM pattern, you can easily replace the sample content with your own, making it adaptable for various use cases like project tracking and performance analysis.
To see a full list of what's new in 2024.4 (version 4.2.117.0), see our release notes.
Grial UI Kit is licensed per application and is available as an perpetual license. See our Grial UI Kit licensing page for full details.
For more information, see our Grial UI Kit product page.
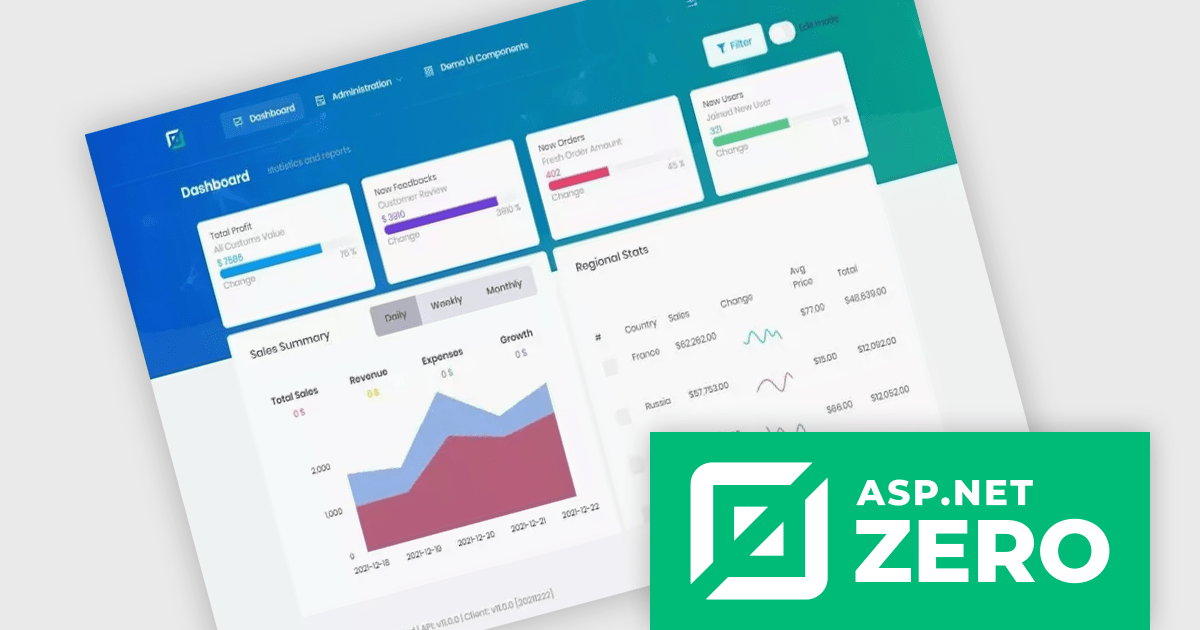
ComponentSource, a leading provider of software development tools, has partnered with ASP.NET Zero (by Volosoft), a software solution provider that creates reusable software libraries/frameworks/tools, distributed architectures/systems, multi-threaded, and real-time applications. The ASP.NET Zero team has extensive experience with Microsoft technologies, JavaScript frameworks, development and design tools, database management systems and mobile development platforms.
ASP.NET Zero is a robust web application development framework specifically designed to expedite the creation of modern, high-performing web applications. It functions as a pre-configured foundation, akin to a pre-built structure with essential utilities already in place. This enables developers to concentrate their efforts on crafting the unique functionalities that differentiate their application.
ASP.NET Zero is licensed based on the number of developers using the framework and the number of products being developed. See our ASP.NET Zero licensing page for full details.
For more information, visit our ASP.NET Zero publisher page.
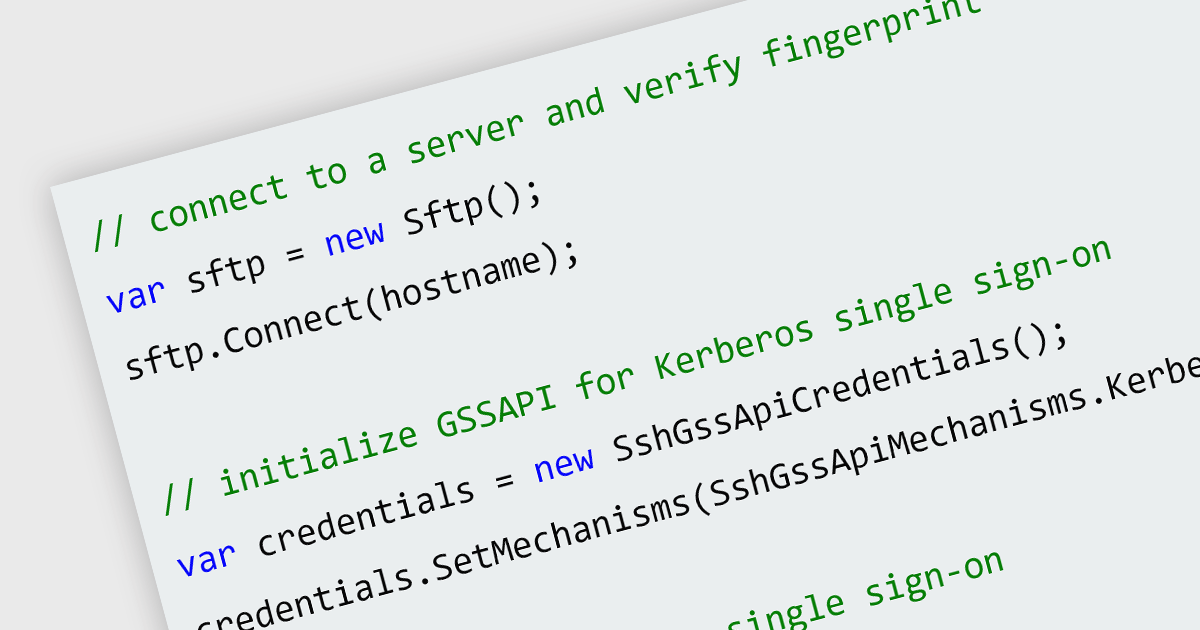
Server-side authentication is a security mechanism that verifies the identity of a user or device requesting access to a server or application. It typically involves the exchange of credentials, such as usernames and passwords, between the client and server, followed by validation of these credentials against a centralized database or directory. This ensures that only authorized individuals or systems can access restricted resources and prevents unauthorized access.
Several .NET 8 communications and messaging components offer support for server-side authentication including:
For an in-depth analysis of features and price, visit our .NET 8 communications and messaging components comparison.
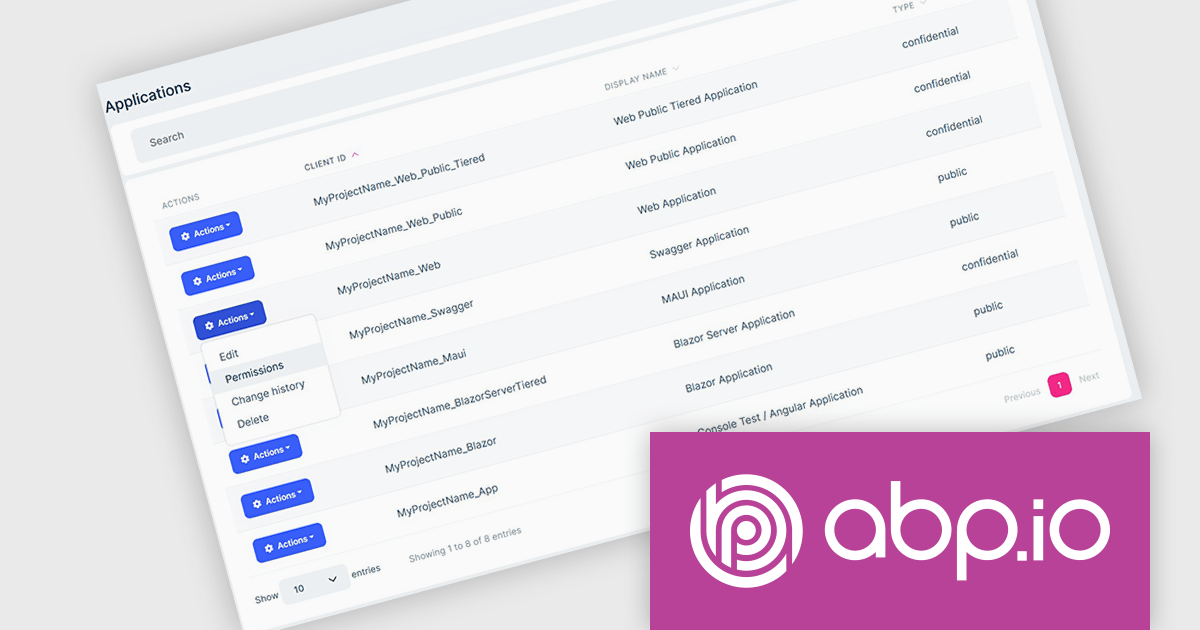
ComponentSource, a leading provider of software development tools, has announced a new partnership with ABP (by Volosoft), a software solution provider that develops reusable software libraries/frameworks/tools, distributed architectures/systems, multi-threaded and real-time applications. Specializing in tools and frameworks built on the .NET ecosystem, Volosoft provides businesses with innovative products that streamline development processes. ABP is known for its professional support services, and strong developer community, making it a trusted partner for organizations worldwide.
The ABP Platform offers an opinionated architecture designed to accelerate the creation of enterprise-level solutions. It provides a modular and layered architecture built on top of ASP.NET Core, allowing developers to create scalable, maintainable, and high-performance applications. ABP Platform offers extensive pre-built modules such as identity management, multi-tenancy, and permission systems, reducing development time and effort. Its flexibility supports microservices, monolithic architectures, and cloud deployments. ABP is ideal for organizations looking to build modern applications with features like user management, auditing, localization, and more, making it a strong choice for SaaS products, internal business tools, or complex distributed systems.
The ABP Platform is available as a Team, Business or Enterprise license, which entitles developers to use the platform's Pro features and provides software updates and technical support for 1 year. See our ABP Platform licensing page for full details.
For more information, visit our ABP publisher page.
전화 : 00798 14 800 6332
팩스 : +1 770 250 6199


