


공식 공급 업체
200 이상의 소프트웨어 개발처와 판매 계약을 맺은 공인 디스트리뷰터로서 합법적인 라이선스를 제공합니다.
모든 브랜드 보기.
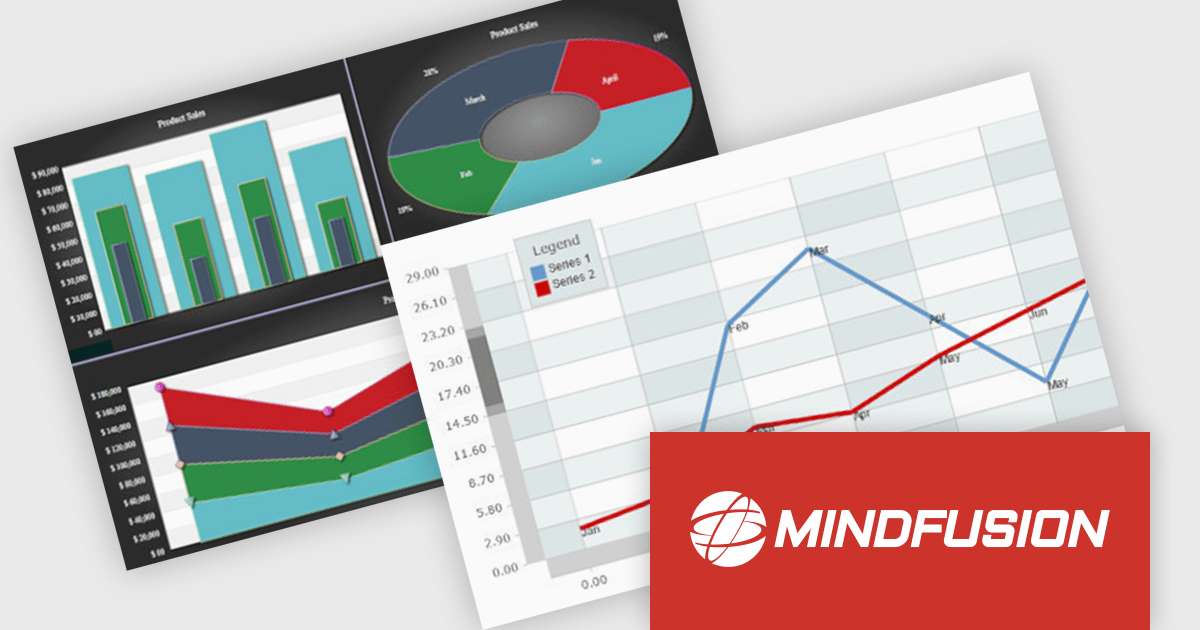
MindFusion.Charting for .NET MAUI is a comprehensive charting library designed specifically for developing data visualizations within .NET MAUI applications. This powerful toolkit empowers developers to create a wide range of chart types, including 2D and 3D charts and intuitive dashboards. The library offers a high degree of customization, allowing developers to tailor the appearance and behavior of charts to perfectly match their application's needs.
Developers can boost their productivity with MindFusion.Charting for .NET MAUI, which simplifies the creation of informative data visualizations. This translates to improved user experiences within applications, as users can gain valuable insights by exploring data through clear and engaging charts. The library's versatility caters to various use cases, making it suitable for applications in business intelligence, scientific analysis, and any scenario where data visualization plays a crucial role.
MindFusion.Charting for .NET MAUI is licensed per developer and is available as a perpetual license with 1 year subscription and support. See our MindFusion.Charting for .NET MAUI licensing page for full details.
For more information, visit our MindFusion.Charting for .NET MAUI product page.
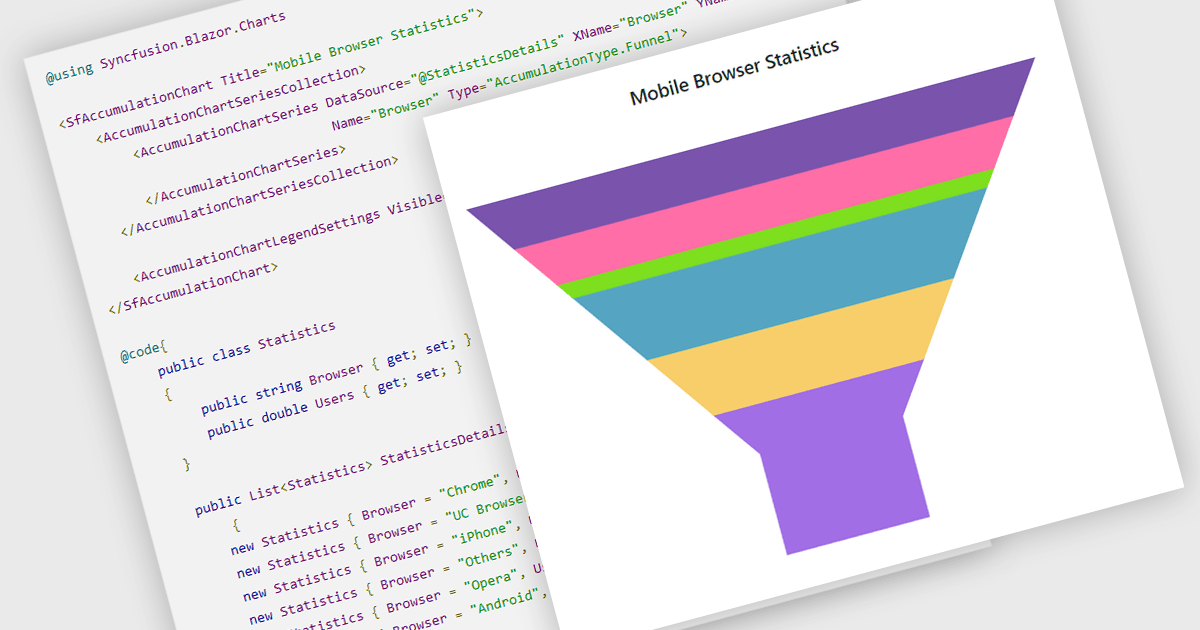
Funnel charts are a type of data visualization that depicts data in a linear process that often narrows down at each stage, resembling a funnel. They are especially useful for emphasizing steps in a process, displaying drop-off rates, and finding bottlenecks in workflows. Funnel charts are useful because they visually show the continual reduction of data throughout phases, providing clear insights into conversion rates and process efficiency. This enables engineers and business analysts to quickly find areas for improvement, optimize procedures, and create more accurate data-driven decisions.
Several .NET Blazor chart controls offer funnel charts including:
For an in-depth analysis of features and price, visit our .NET Blazor chart controls comparison.
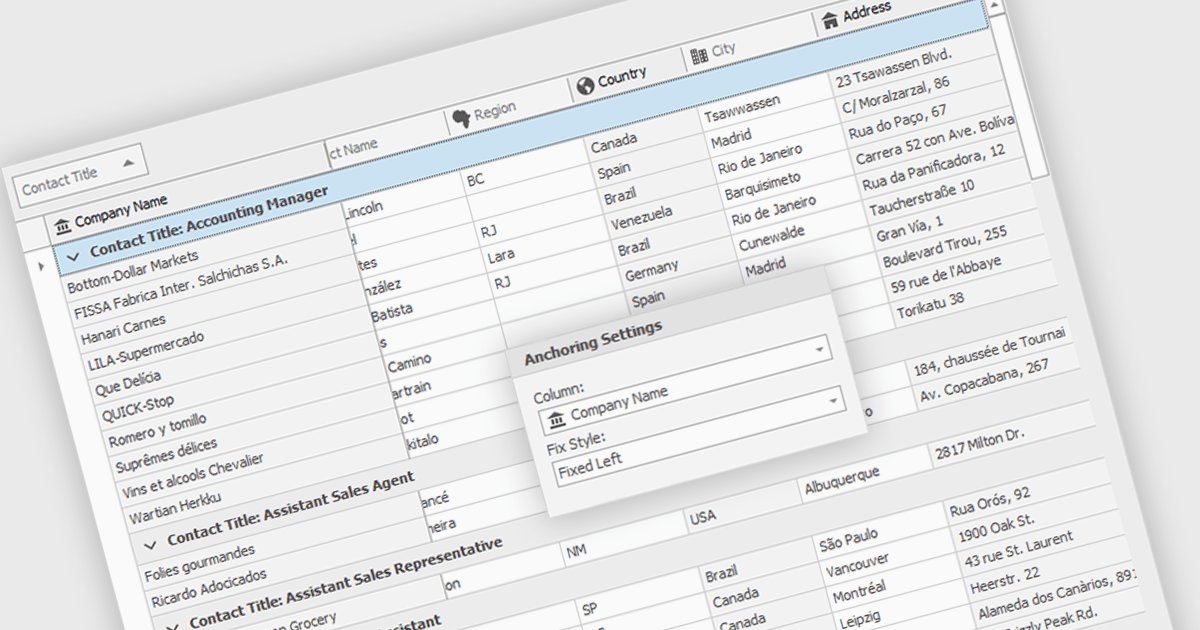
Freezing columns allows specific grid columns to remain visible on the screen while the user scrolls horizontally across the rest of the data. This functionality is beneficial for software developers because it improves user experience by ensuring important reference information, like row identifiers or column headers, stays constantly in view regardless of the data set's width. This can significantly aid in data comprehension and navigation for users working with large datasets.
Several WinForms grid components allow you to freeze columns, including:
For an in-depth analysis of features and price, visit our WinForms grid components comparison.
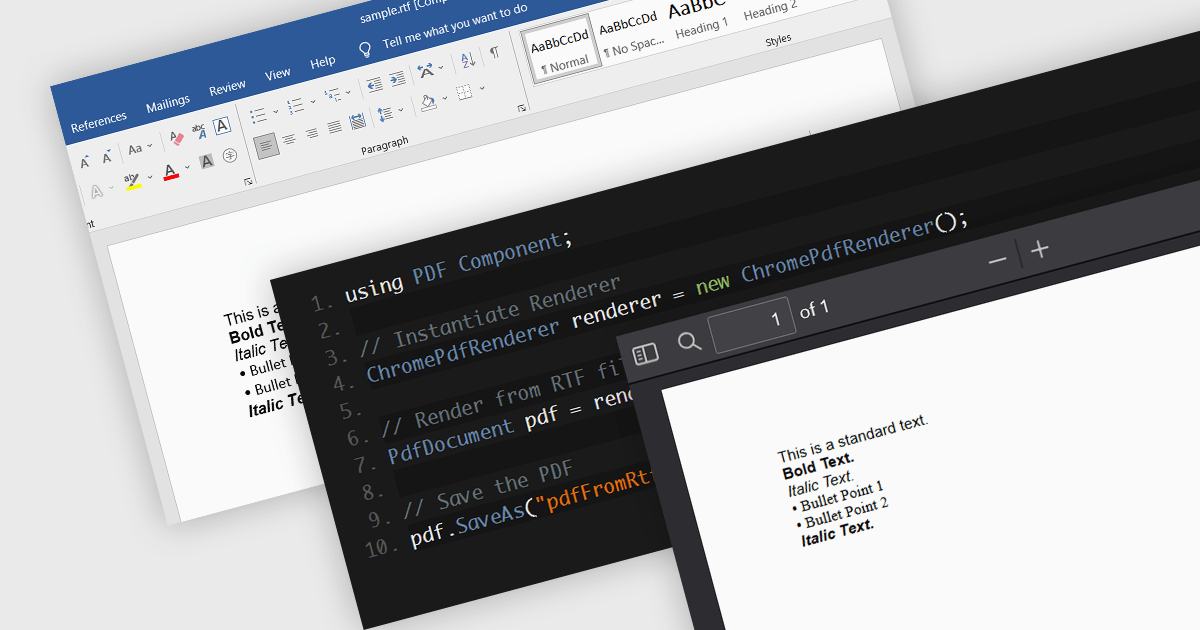
PDF components with RTF to PDF conversion support empower users to transform rich text documents into universally compatible PDFs. This functionality offers significant advantages, including ensuring consistent formatting across different devices and platforms, enhancing document security with features like password protection, and simplifying file sharing with recipients who may not have access to the original RTF editing software. This functionality is valuable for a variety of scenarios, from generating secure and presentable reports to easily sharing formatted text content with collaborators.
Several .NET 8 PDF components allow you to convert RTF to PDF, including:
For an in-depth analysis of features and price, visit our comparison of .NET 8 PDF components.
Layout components are reusable building blocks that define the structure and arrangement of content within a user interface. They encapsulate layout logic such as grid systems, promoting code reusability, consistency, and maintainability. By abstracting layout, these components enhance development efficiency and improve the overall design cohesion of an application.
Several WPF UI suites offer layout components including:
For an in-depth analysis of features and price, visit our WPF UI suites comparison.
전화 : 00798 14 800 6332
팩스 : +1 770 250 6199


