


공식 공급 업체
200 이상의 소프트웨어 개발처와 판매 계약을 맺은 공인 디스트리뷰터로서 합법적인 라이선스를 제공합니다.
모든 브랜드 보기.
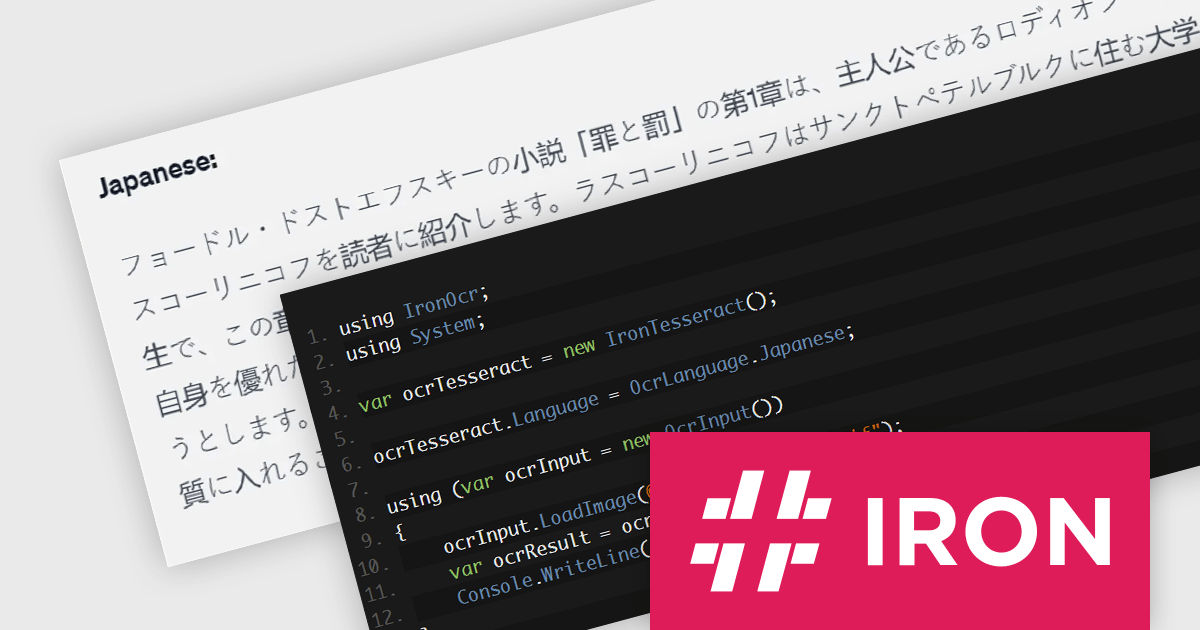
IronOCR for .NET by Iron Software is a C# library designed for adding advanced Optical Character Recognition (OCR) functionality to .NET applications. It leverages the Tesseract engine for accurate text, barcode, and QR code recognition from all major image and PDF formats. It is compatible with a variety of platforms (including C#, VB.NET, F#), operating systems (such as Windows, macOS, Linux), and IDEs (for example Visual Studio, JetBrains ReSharper and Rider). IronOCR offers a variety of features, supports over 127 languages, and provides a comprehensive solution for text extraction needs, enabling developers to implement OCR capabilities efficiently and effectively.
The IronOCR for .NET 2024.6.3 update enhances its advanced scan mode by supporting a wider range of languages including Chinese, Traditional Chinese, Japanese, Korean, and Latin. This enhancement significantly broadens an application's utility in global markets by allowing for text, barcode, and QR code recognition in more languages. Crucial for businesses operating internationally or in multilingual environments, this streamlines text extraction workflows and increases the versatility of their .NET projects whilst making it easier to handle complex script languages. By expanding the supported languages, developers can now cater to a more diverse user base, ensuring that their applications are accessible and relevant to a wider audience.
To see a full list of what's new in 2024.6.3, see our release notes.
IronOCR for .NET is licensed based on the number of developers, organization locations and projects, and is available as a Perpetual license with one free year of product updates and support services. See our IronOCR for .NET licensing page for full details.
IronOCR for .NET is available in the following products:
ComponentOne Studio WPF by MESCIUS is a comprehensive suite of controls designed to enhance the development of WPF applications. It offers a range of powerful and flexible UI components such as data grids, charts, and data visualization tools that integrate seamlessly into WPF projects. This suite enables developers to create modern, responsive, and visually appealing applications with greater efficiency, leveraging robust features and customization options. Its components are optimized for performance and ease of use, allowing for the rapid development of high-quality WPF applications that meet complex business requirements.
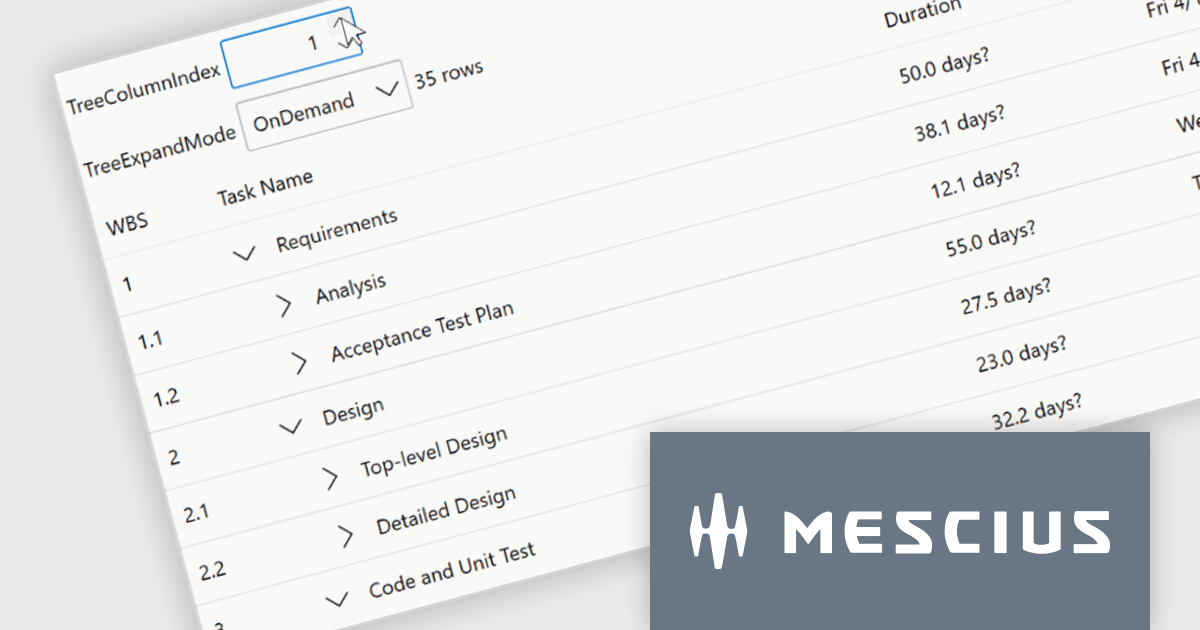
The ComponentOne Studio WPF 2024 v1 update introduces a new TreeGrid feature to FlexGrid for WPF, enabling developers to visualize and manage hierarchical data structures directly within the familiar FlexGrid interface. This eliminates the need for separate TreeView controls, streamlining development and improving data presentation clarity for applications that handle nested information. TreeGrids excel at displaying data with inherent parent-child relationships, making them ideal for visualizing nested structures like file systems, organizational charts, product categories with subcategories, or threaded comments.
To see a full list of what's new in 2024 v1, see our release notes.
ComponentOne Studio WPF is licensed per developer on a perpetual basis and includes a 12 month subscription. See our ComponentOne Studio WPF licensing page for full details.
Learn more on our ComponentOne Studio WPF product page.
DevExpress Blazor (part of DevExpress ASP.NET and Blazor) helps you create high-impact user experiences for both Blazor Server and Blazor WebAssembly using C#. The Blazor UI Component Library ships with a comprehensive set of native components (including a DataGrid, Pivot Grid, Scheduler, Chart, Data Editors and Reporting).
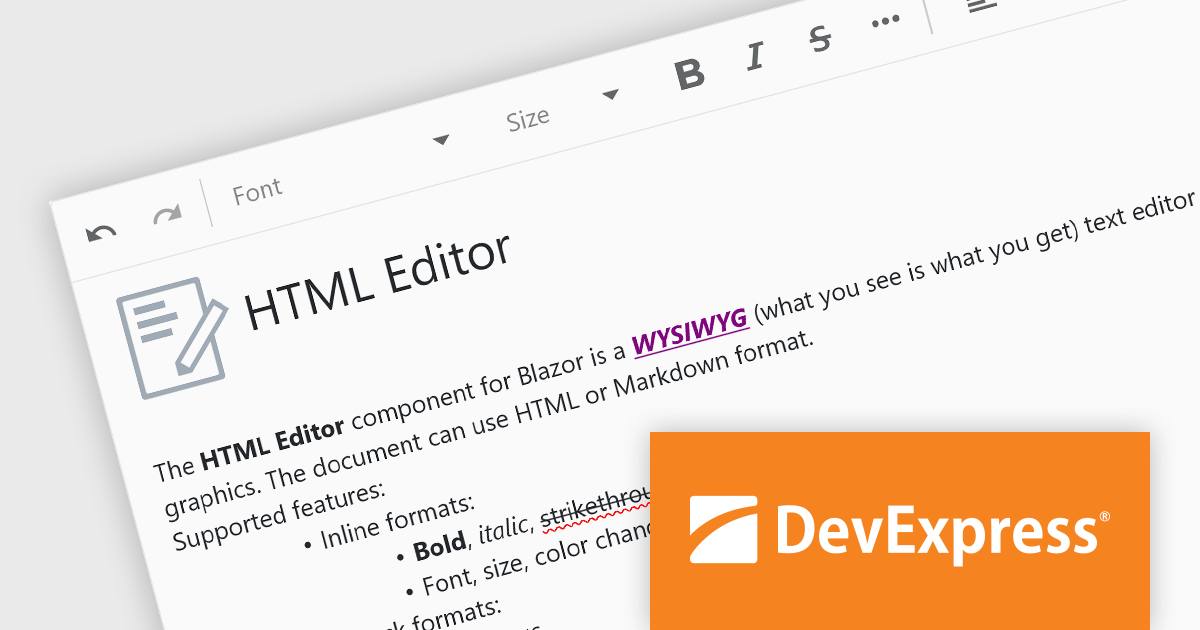
The DevExpress Blazor 24.1 release adds an all-new HTML Editor. This intuitive tool empowers users to craft visually appealing and informative content with ease. Go beyond plain text by incorporating formatting options like bold, italics, and headings. Fine-tune the look and feel of your content by adjusting font styles, sizes, and colors to match your brand identity. It offers the flexibility to store your creations in either HTML or Markdown format, catering to different needs and workflows. This level of control and versatility makes the Blazor HTML Editor a perfect fit for anyone looking to elevate their content creation experience.
To see a full list of what's new in version 24.1, see our release notes.
DevExpress ASP.NET and Blazor is licensed per developer and is available as a Perpetual License with a 12 month support and maintenance subscription. See our DevExpress ASP.NET and Blazor licensing page for full details.
DevExpress Blazor is available in the following products:
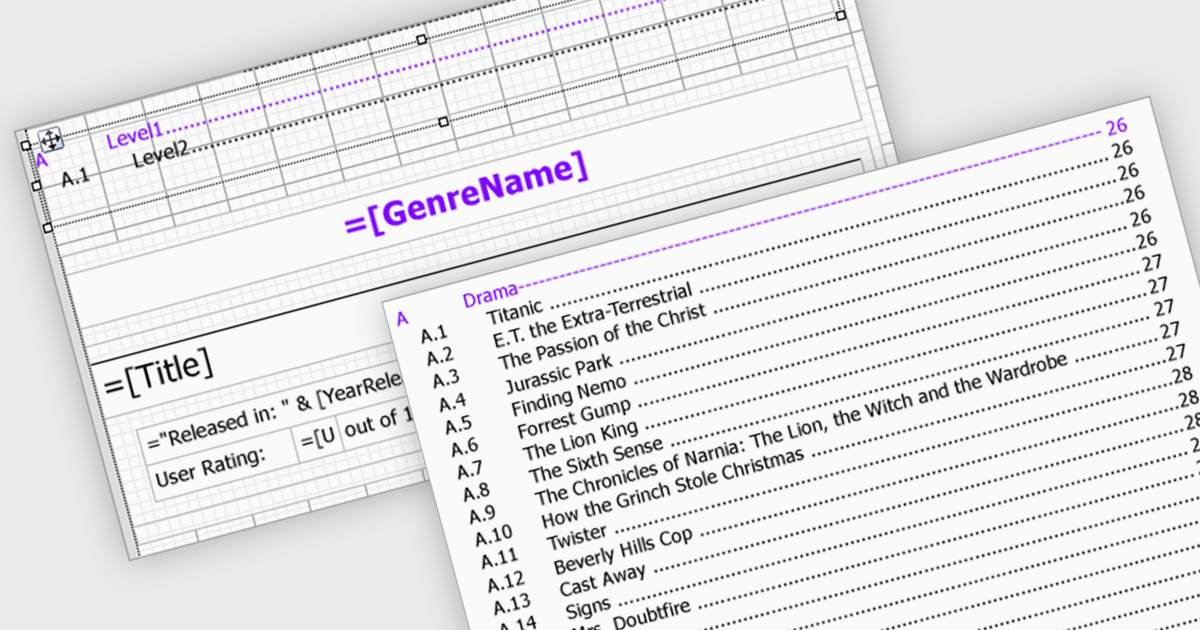
Reporting components streamline document creation by offering automatic Table of Contents (TOC) generation. This feature scans a document for designated headings, like titles and subtitles, and builds a clickable index at the beginning. This not only enhances professionalism but also improves user experience by allowing for easy navigation within lengthy reports. Automatic TOC generation proves particularly valuable for complex documents, research papers, and technical manuals, where readers might need to quickly jump to specific sections.
Several WinForms reporting components support Table of Contents (TOC) features, including:
For an in-depth analysis of features and price, visit our comparison of WinForms reporting components.

Conditional formatting in a spreadsheet component allows you to dynamically alter the visual appearance of cells based on predefined rules. This functionality enhances data readability by highlighting specific values or trends within your spreadsheet. By visually differentiating critical information, conditional formatting empowers developers to create more user-friendly and informative data presentations within their ASP.NET applications.
Several ASP.NET Core Assembly Spreadsheet Controls offer Conditional Formatting including:
For an in-depth analysis of features and price, visit our comparison of ASP.NET Core Assembly Spreadsheet Controls.
전화 : 00798 14 800 6332
팩스 : +1 770 250 6199


