













공식 공급 업체
200 이상의 소프트웨어 개발처와 판매 계약을 맺은 공인 디스트리뷰터로서 합법적인 라이선스를 제공합니다.
모든 브랜드 보기.
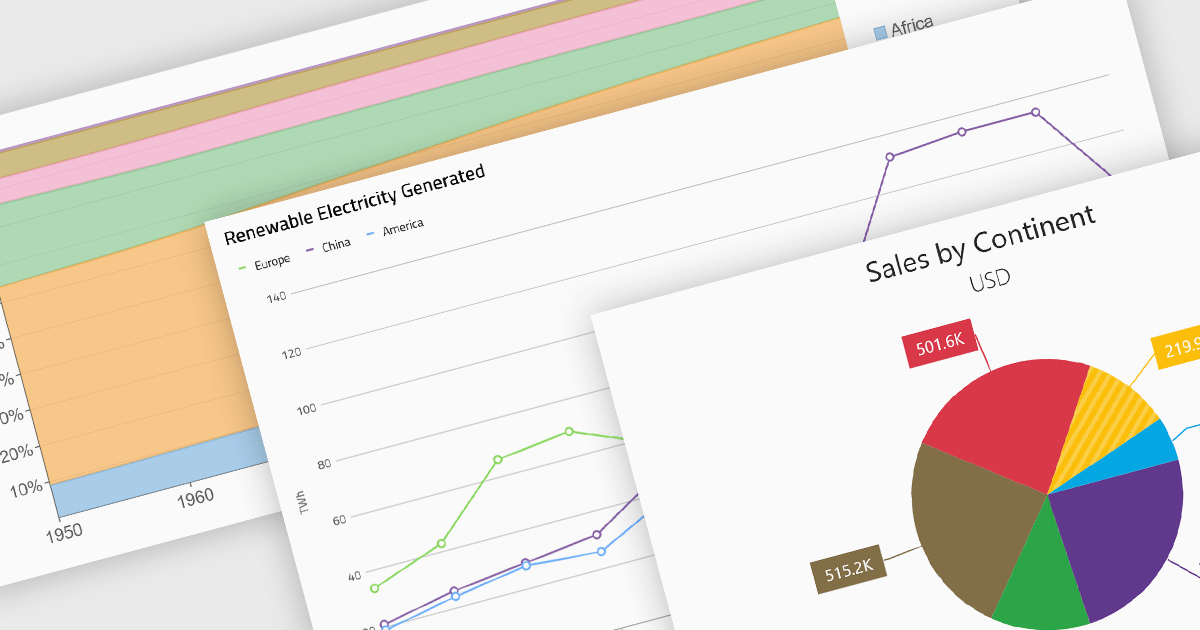
Standard chart types form the foundation of most charting components, providing widely recognized visual formats for representing numerical and categorical data. These charts help developers present trends, comparisons, distributions, and relationships in ways that are immediately understandable to end users. Because these visualizations are familiar across industries, they are commonly included as built-in options in charting libraries and dashboards, allowing applications to communicate insights clearly while supporting interactive features such as tooltips, legends, and dynamic data updates.
Common chart types include:
For an in-depth analysis of features and price, visit our Blazor charts components comparison.
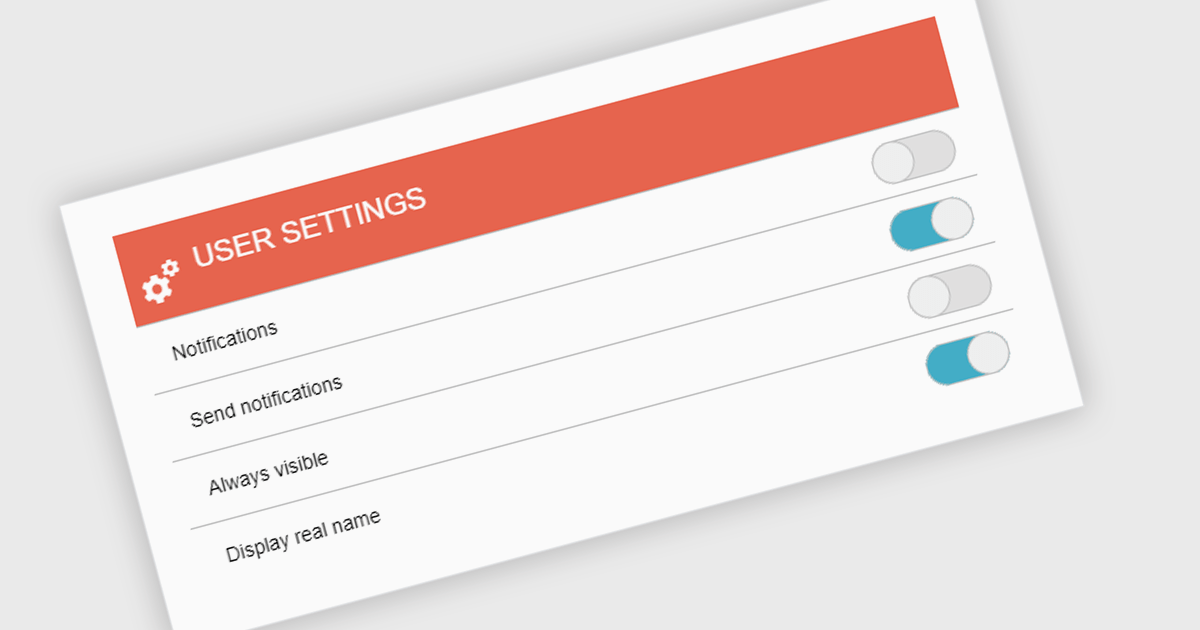
A toggle switch is a user interface control that allows users to quickly switch between two states, typically on and off. It provides a clear visual indication of the current state and enables immediate changes with a single interaction. Toggle switches are widely used in forms, settings panels, and configuration interfaces because they present binary choices in a compact and easily understandable format. Their visual clarity helps reduce user errors, while their interactive design supports efficient input and consistent behavior across desktop and mobile applications.
Several .NET data editor collections give you toggle switch functionality, including:
For an in-depth analysis of features and price, visit our comparison of .NET data editor collections.
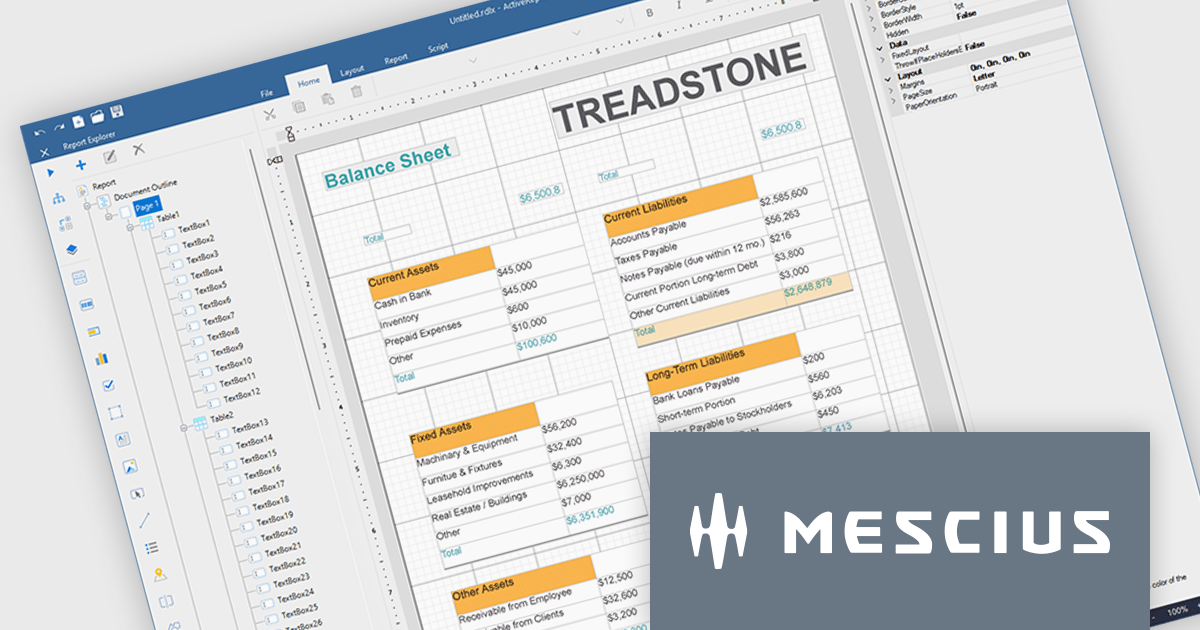
ActiveReports.NET helps you deliver beautiful reports with intuitive Visual Studio integrated report designers and rich controls. ActiveReports provides code-based cross-platform reporting, easy-to-use designers, and a flexible API. MESCIUS recently released ActiveReports.NET v20, which includes the powerful AI Image to report feature.
In this blog post, MESCIUS Product Manager Alec Gall presents a detailed walkthrough for creating a report from an image in the Designer. Steps include:
Read the full blog to learn how to turn screenshots, scans, and even photographs of reports into editable .NET RDL reports.
ActiveReports.NET is licensed per developer. Dependent on geographic location it is available as either an Annual (Timed) Subscription License or as a Perpetual Developer License which comes with 1 year of software updates and support. Each developer requires a license to design, develop, or maintain applications. The Annual Subscription License must be renewed each year to continue to work with the software. Published applications are royalty free and do not expire. Optional pipeline licenses available for CI/CD build servers. See our ActiveReports.NET licensing page for full details.
Learn more on our ActiveReports.NET product page.
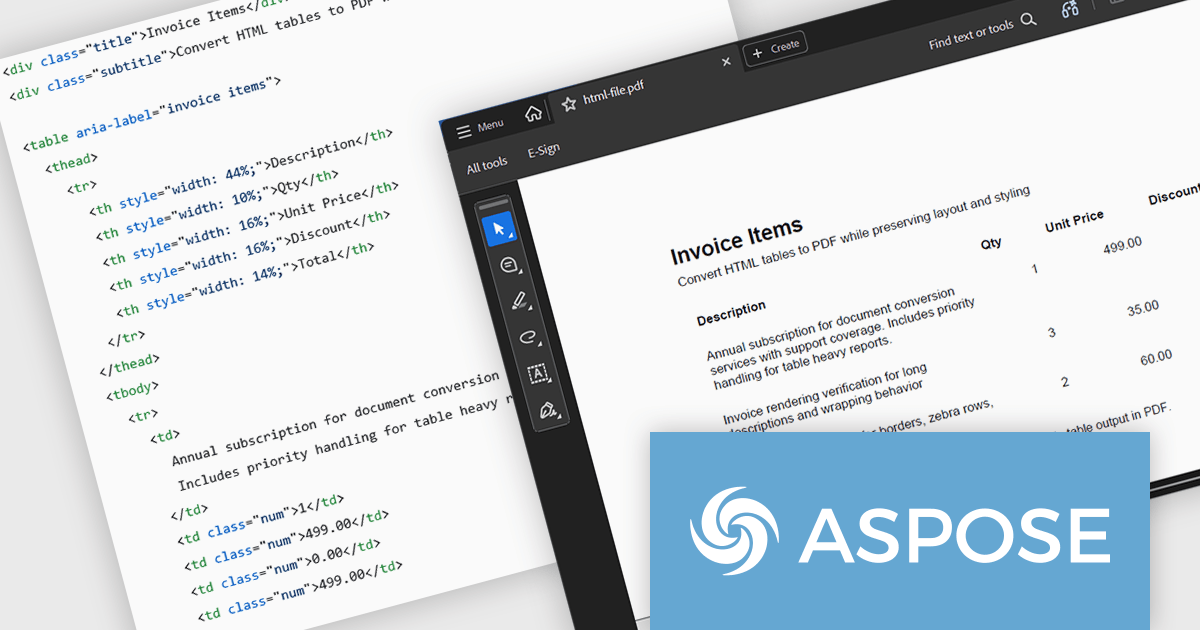
Aspose.HTML for Python via .NET is an advanced API for HTML processing that allows for a wide range of management and manipulation tasks in cross-platform applications. The API can create, modify, extract data, convert, and render HTML documents without the need for external software. It supports popular file formats such as EPUB, MHTML, XML, SVG, and Markdown and can render to PDF, DOCX, XPS, and Image file formats.
In this blog post, Aspose provides a step-by-step guide to convert HTML tables to PDF with Aspose.HTML in Python via .NET while preserving table layout and styling. You will start with a clean table template, then add custom CSS, custom page size, footer text, and page numbers for report grade PDFs. Steps include:
Detailed code is included, along with a guide to troubleshoot common table issues.
Read the full blog to learn how to convert HTML tables into clean, well-formatted PDF documents.
Aspose.HTML for Python via .NET is offered as Developer Small Business, Developer OEM, Developer SDK, Site Small Business, Site OEM, and Site SDK licenses catering to a range of business needs. Licenses are perpetual, and include 1 year of support and maintenance. Subscription renewals are also available. See our Aspose.HTML for Python via .NET licensing page for full details.
Aspose.HTML for Python via .NET is available in the following products:
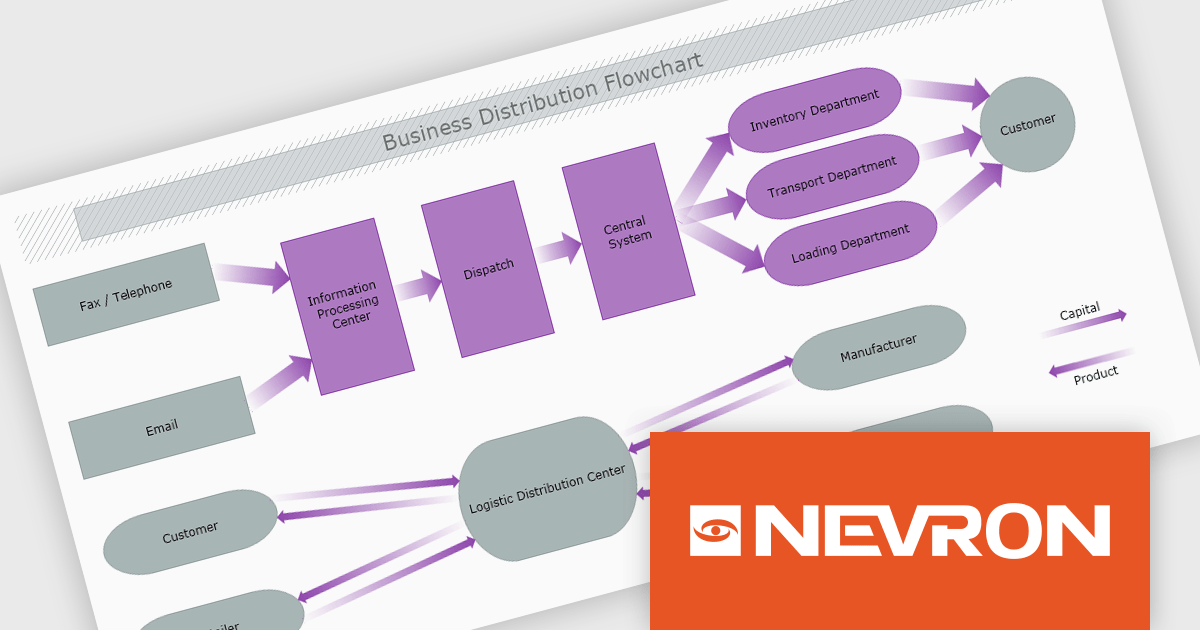
The Nevron .NET development components provide a comprehensive suite of components designed to help developers build advanced data presentation and visualization applications. It includes Nevron Chart for .NET, Nevron Diagram for .NET and Nevron User Interface for .NET, delivering tools for integrating charts, diagrams and rich user interface elements into Windows Forms and ASP.NET applications. With a well-structured object model, extensive features and flexible customization options, the suite enables developers to create applications that effectively visualize complex business, scientific or financial data while supporting interactive diagrams, automatic layouts and high-quality visual presentation.
The Nevron .NET product range now supports .NET Core 10.0 for its WinForms and WPF controls, enabling developers to build and maintain desktop applications using the latest .NET platform. Developers can take advantage of ongoing performance, security, and runtime enhancements in newer .NET versions without changing their UI component libraries, helping improve upgrades and maintain long-term platform alignment.
The Nevron .NET product range is licensed per developer machine and is available as a perpetual license with 1 year subscription and support. See our Nevron Vision for .NET licensing page for full details.
Support for .NET 10 is available across the Nevron .NET product range:
전화 : 00798 14 800 6332
팩스 : +1 770 250 6199


