


공식 공급 업체
200 이상의 소프트웨어 개발처와 판매 계약을 맺은 공인 디스트리뷰터로서 합법적인 라이선스를 제공합니다.
모든 브랜드 보기.
FastReport .NET Ultimate is a comprehensive reporting solution for developers working within the Microsoft .NET ecosystem. It supports the creation, design, and delivery of rich, interactive reports across Windows Forms, ASP.NET, MVC, and .NET Core applications. The Ultimate edition includes server deployment capabilities and extensive export options, such as PDF, Excel, Word, and HTML. It connects to various data sources, including SQL databases and business objects, providing flexibility for enterprise-level reporting. With the integrated FastReport Online Designer, users can edit reports directly in their browsers, enabling efficient collaboration and modern, full-featured report design across both desktop and web platforms.
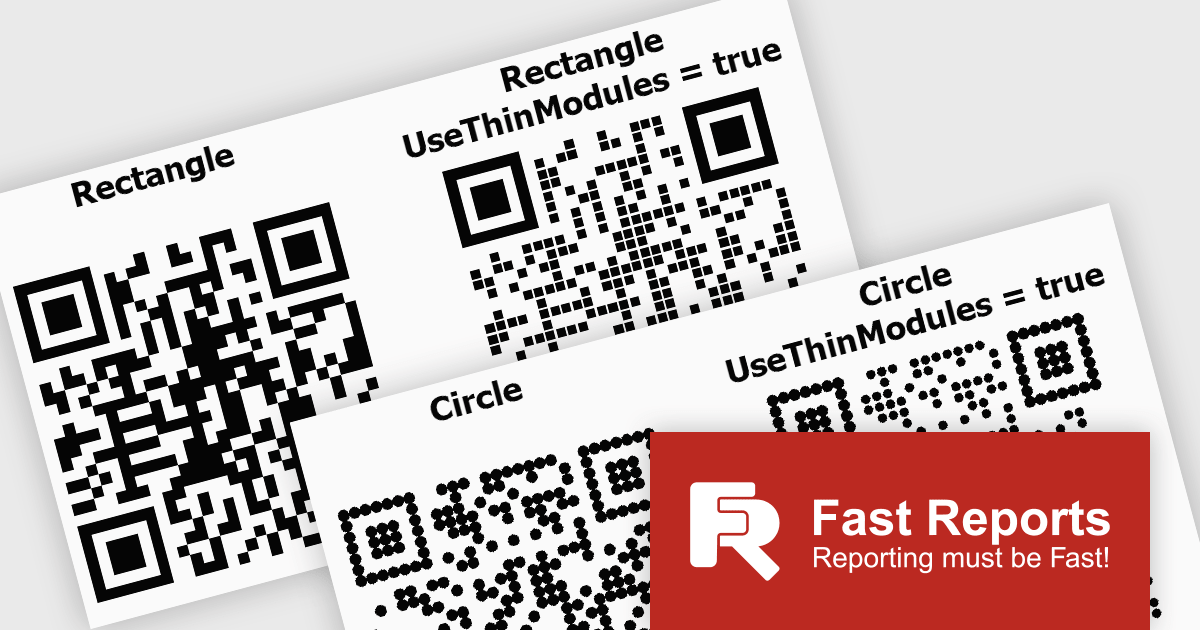
FastReport .NET Ultimate offers developers flexibility when generating QR codes, making it easier to adapt their appearance to different applications, reports, and branding requirements. By supporting a wider range of visual styles directly within the reporting engine, it enables teams to create QR codes that integrate more naturally into user interfaces, printed documents, dashboards, and customer facing materials. This helps produce more polished and professional output while maintaining compatibility, readability, and reliable scanning across standard QR code readers and devices.
FastReport .NET Ultimate is licensed per named user and is available as a perpetual license with a one-year subscription for updates and support. See our FastReport .NET Ultimate licensing page for full details.
For more information, visit our FastReport .NET Ultimate product page.
LEADTOOLS Recognition SDK is a software development toolkit designed for building applications that extract data from images and documents. It empowers developers with features like Optical Character Recognition (OCR) for converting scanned documents to text, barcode reading, and form processing. Additionally, it offers functionalities for handling various file formats, image pre-processing, and document viewing, making it a comprehensive solution for automating document workflows in enterprises and organizations.
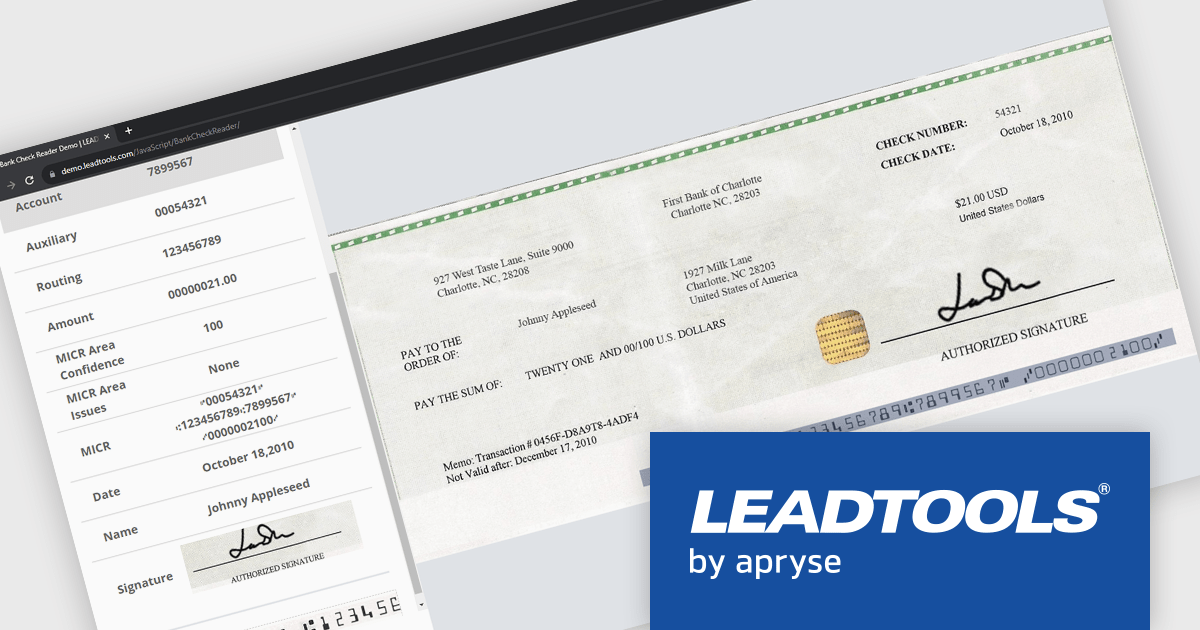
LEADTOOLS Recognition SDK enables developers to automatically read and parse MICR data from checks, extracting routing, account, and check numbers with high accuracy. This capability helps streamline check processing workflows, reduce manual data entry, minimize errors, and accelerate the integration of financial document capture into banking, payment, and accounts processing applications.
LEADTOOLS Recognition SDK is licensed as Development Licenses, for developers to use the SDKs, and Deployment Licenses, for the right to distribute end user solutions. See our LEADTOOLS Recognition SDK licensing page for full details.
Learn more on our LEADTOOLS Recognition SDK product page.
ONLYOFFICE Docs is a comprehensive online editor, allowing users to create text documents, spreadsheets, presentations, and forms. It enables your users to edit, share, and collaborate on documents online in their preferred browser, within your own application. It is fully compatible with OOXML (Office Open XML) formats and supports popular Microsoft Office and other document formats such as CSV, DOC, DOCX, EPUB, HTML, ODP, ODS, ODT, PDF, PPT, PPTX, RTF, TXT, XLS, and XLSX.
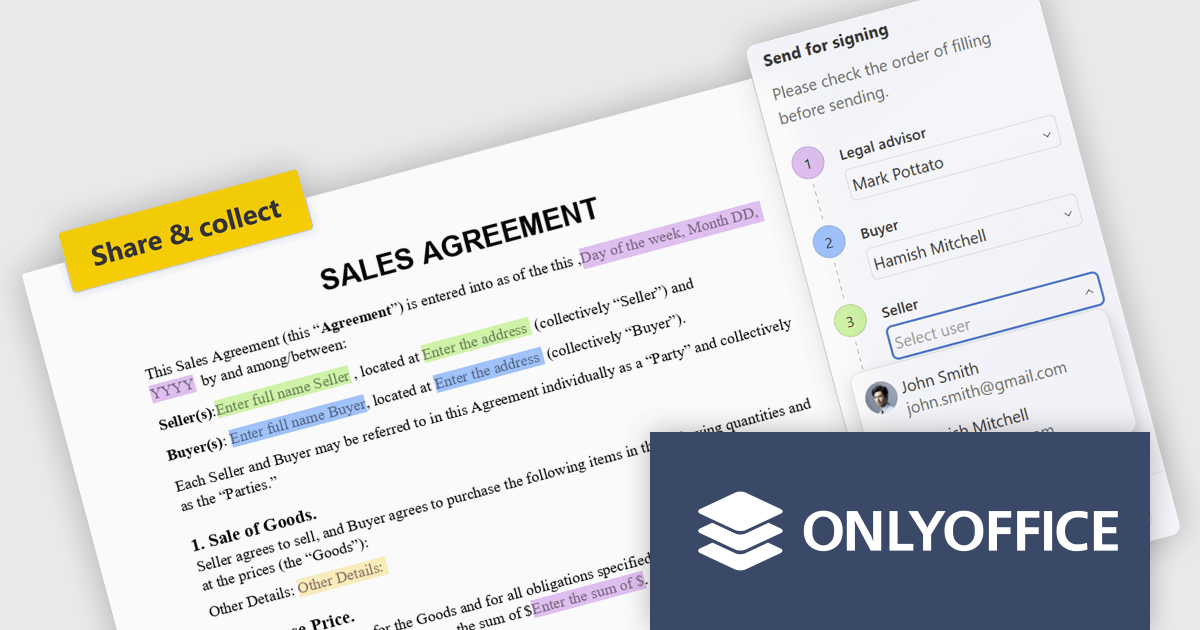
The ONLYOFFICE Docs 9.4 update introduces built in recipient assignment and filling status tracking directly within the editor, allowing developers and teams to manage form workflows more efficiently without relying on separate tools or administrative steps. By centralizing recipient management and completion monitoring in a single interface, the feature provides greater visibility into form progress, reduces context switching, and simplifies workflow coordination. This helps improve document driven processes, improves productivity, and enables faster tracking and follow up of outstanding form actions.
To see a full list of what's new in v9.4, see our release notes.
ONLYOFFICE Docs Developer Edition is licensed by the number of simultaneous document connections and is available as an annual license with 1 year support and upgrades. See our ONLYOFFICE Docs Developer Edition licensing page for full details.
For more information, see our ONLYOFFICE Docs Developer Edition product page.
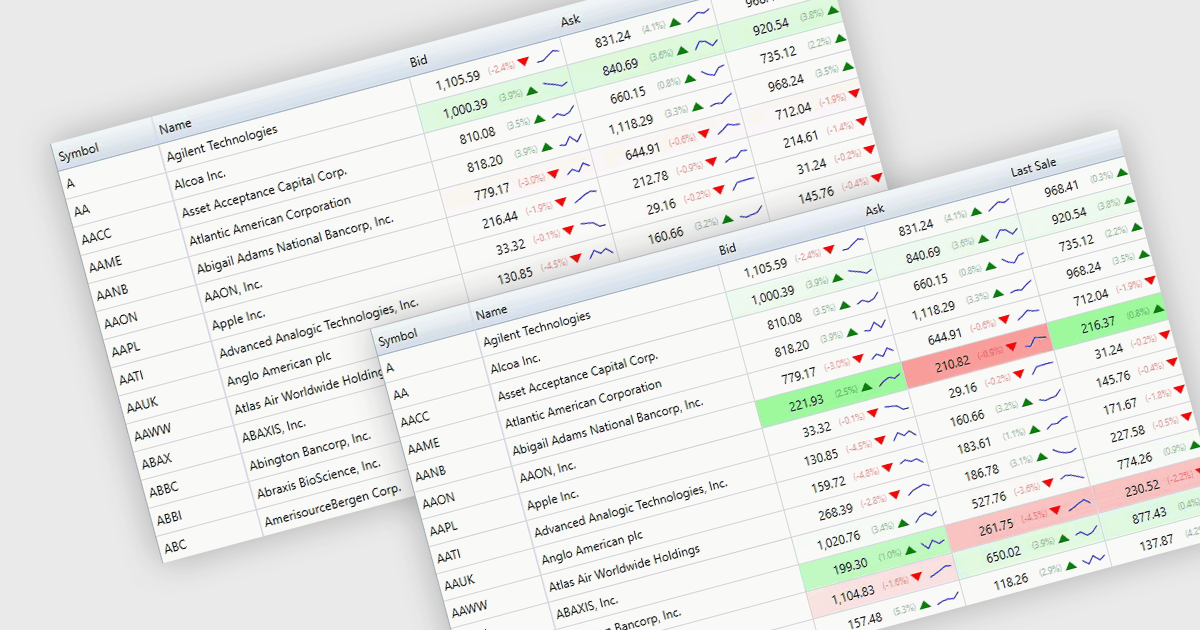
Dynamic updates, also known as live data rendering, enable a data grid to automatically refresh displayed information when the underlying data source changes, without requiring manual intervention, a full-page reload, or a complete grid refresh. This helps users work with current data while maintaining their position and context within the grid. Depending on the implementation, dynamic updates can refresh only affected records or cells, reducing unnecessary rendering, improving responsiveness, and limiting avoidable data transfer. This capability is especially valuable in applications where timely visibility of changing information is important, such as financial dashboards, operational monitoring systems, and inventory management solutions.
Several .NET components provide data grids that allow dynamic updates, including:
For an in-depth analysis of features and price, visit our comparison of .NET grid components.
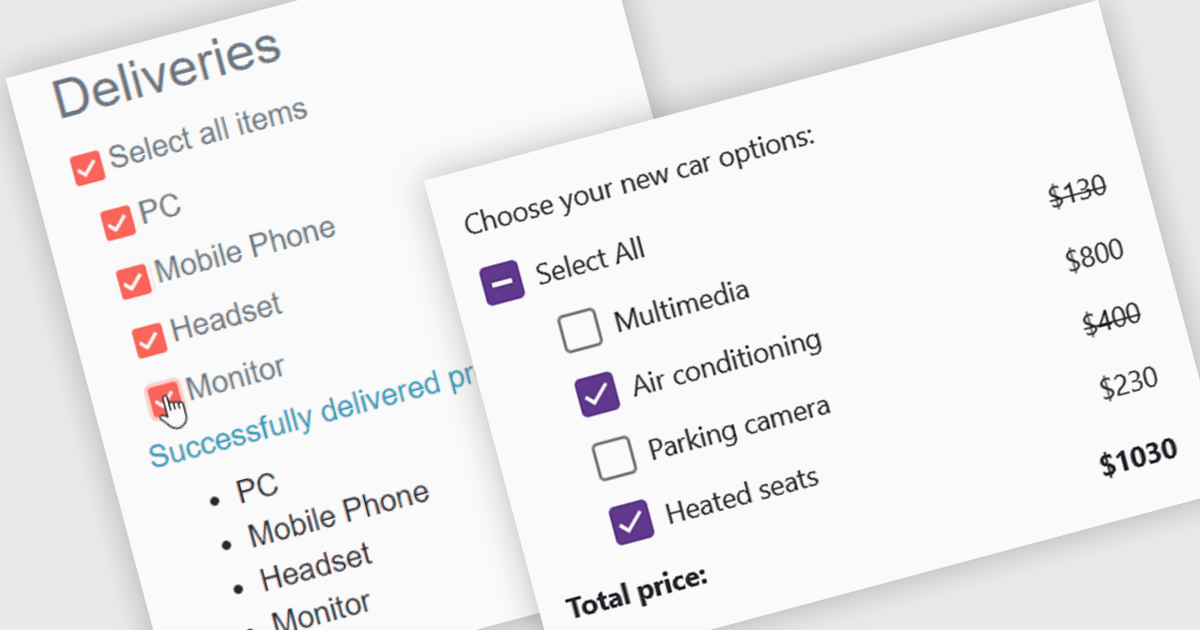
A checkbox data editor is a user interface element that enables users to view and modify Boolean values within forms, data grids, or other data-bound components. It provides an intuitive way to represent true/false, enabled/disabled, or selected/unselected states while maintaining synchronization between the user interface and the underlying data model. For developers, checkbox data editors simplify data entry and validation, improve usability by presenting state-based values in a familiar format, reduce input errors compared to manual text entry, and integrate with Blazor’s data binding and event-handling capabilities to support responsive, maintainable applications.
Several .NET Blazor data editor collections contain checkbox editors including:
For an in-depth analysis of features and price, visit our comparison of .NET Blazor data editors.
전화 : 00798 14 800 6332
팩스 : +1 770 250 6199


