













공식 공급 업체
200 이상의 소프트웨어 개발처와 판매 계약을 맺은 공인 디스트리뷰터로서 합법적인 라이선스를 제공합니다.
모든 브랜드 보기.
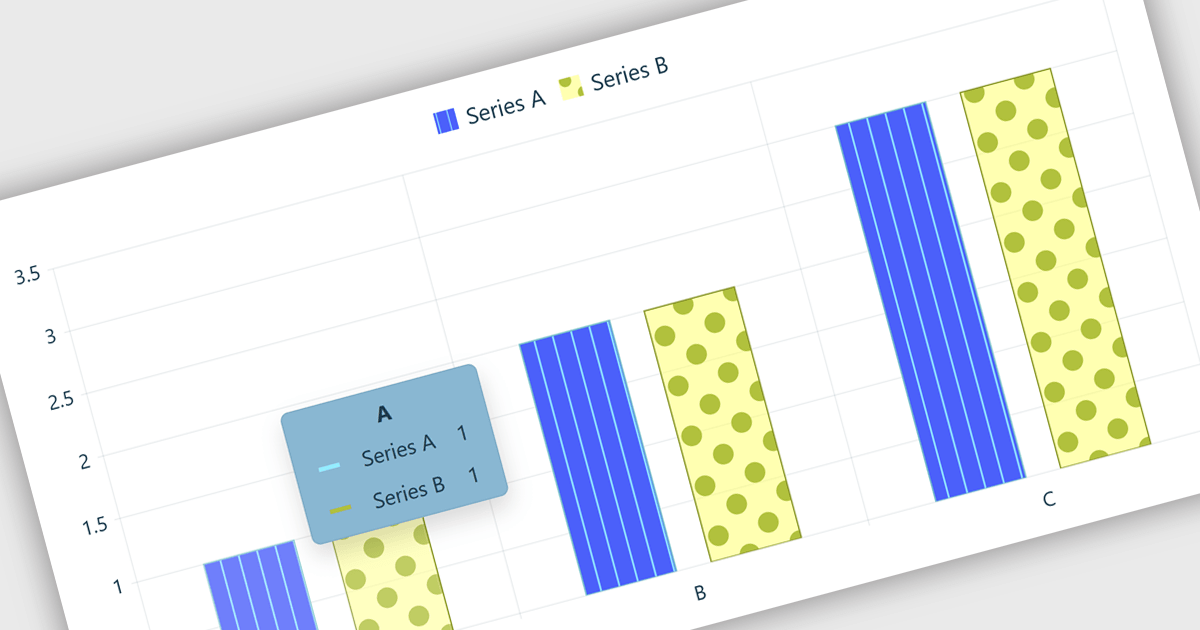
Chart tooltips in a charting component are interactive elements that display additional information about data points when users hover over or interact with a chart. They help software developers enhance data visualizations by providing detailed values, contextual insights, and comparisons on demand without cluttering the chart itself, improving usability, supporting more effective data analysis, and creating a more engaging user experience.
Several React chart controls offer tooltip support including:
For an in-depth analysis of features and price, visit our React chart controls comparison:
ZingGrid is a JavaScript library that simplifies the creation of interactive data tables and grids within web applications. Utilizing modern web components and focusing on performance and responsiveness, ZingGrid allows developers to implement features like searching, filtering, pagination, and in-line editing with minimal coding. This empowers efficient data visualization and manipulation for users, making it a valuable tool for web development.
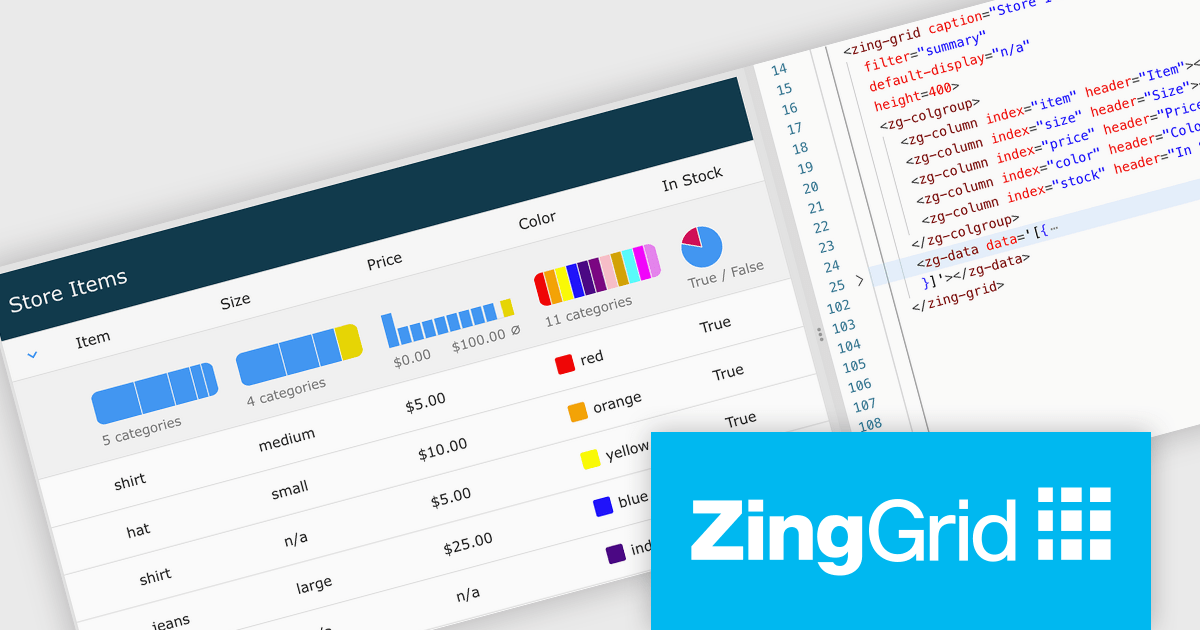
The ZingGrid 2.2.0 update introduces a Filter Summary Chart that enables users to visually explore and filter data through an interactive chart interface, making it easier to identify patterns, trends, and distributions within large datasets. By combining data visualization with filtering functionality, the feature helps users refine results more intuitively and efficiently than traditional filter controls, while allowing developers to quickly add this capability at either the grid or column level with minimal configuration.
To see a full list of what's new in version 2.2.0, see our release notes.
ZingGrid is available as either a Single-Domain Website or Multi-Domain SaaS license. See our ZingGrid licensing page for full details.
For more information, visit our ZingGrid product page.
ONLYOFFICE Docs is a comprehensive online editor, allowing users to create text documents, spreadsheets, presentations, and forms. It enables your users to edit, share, and collaborate on documents online in their preferred browser, within your own application. It is fully compatible with OOXML (Office Open XML) formats and supports popular Microsoft Office and other document formats such as CSV, DOC, DOCX, EPUB, HTML, ODP, ODS, ODT, PDF, PPT, PPTX, RTF, TXT, XLS, and XLSX.
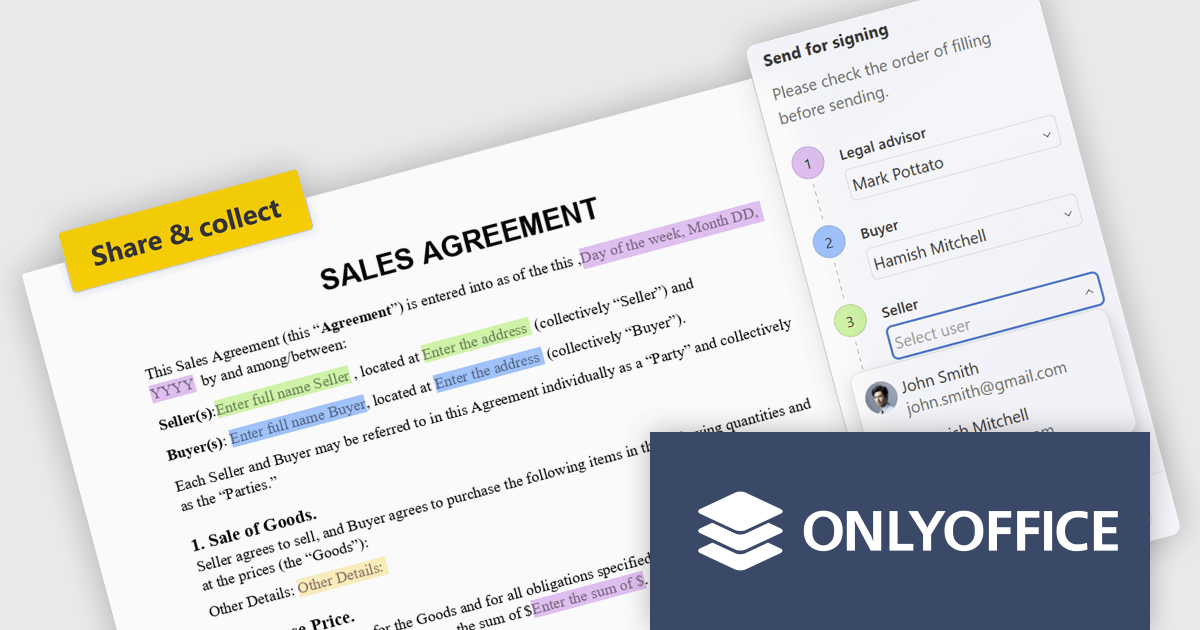
The ONLYOFFICE Docs 9.4 update introduces built in recipient assignment and filling status tracking directly within the editor, allowing developers and teams to manage form workflows more efficiently without relying on separate tools or administrative steps. By centralizing recipient management and completion monitoring in a single interface, the feature provides greater visibility into form progress, reduces context switching, and simplifies workflow coordination. This helps improve document driven processes, improves productivity, and enables faster tracking and follow up of outstanding form actions.
To see a full list of what's new in v9.4, see our release notes.
ONLYOFFICE Docs Developer Edition is licensed by the number of simultaneous document connections and is available as an annual license with 1 year support and upgrades. See our ONLYOFFICE Docs Developer Edition licensing page for full details.
For more information, see our ONLYOFFICE Docs Developer Edition product page.
Highcharts is a JavaScript charting framework that allows web developers and data analysts to generate dynamic, visually appealing charts and graphs for websites and web applications. It can display a variety of chart types, including line, spline, area, column, bar, pie, scatter, and many more. Highcharts is well-known for its ease of use, rich documentation, and ability to handle huge datasets efficiently. Features include responsive design, accessibility support, and cross-browser compatibility. Its customization capabilities allow users to create bespoke data visualizations that increase engagement and provide insightful data presentations.
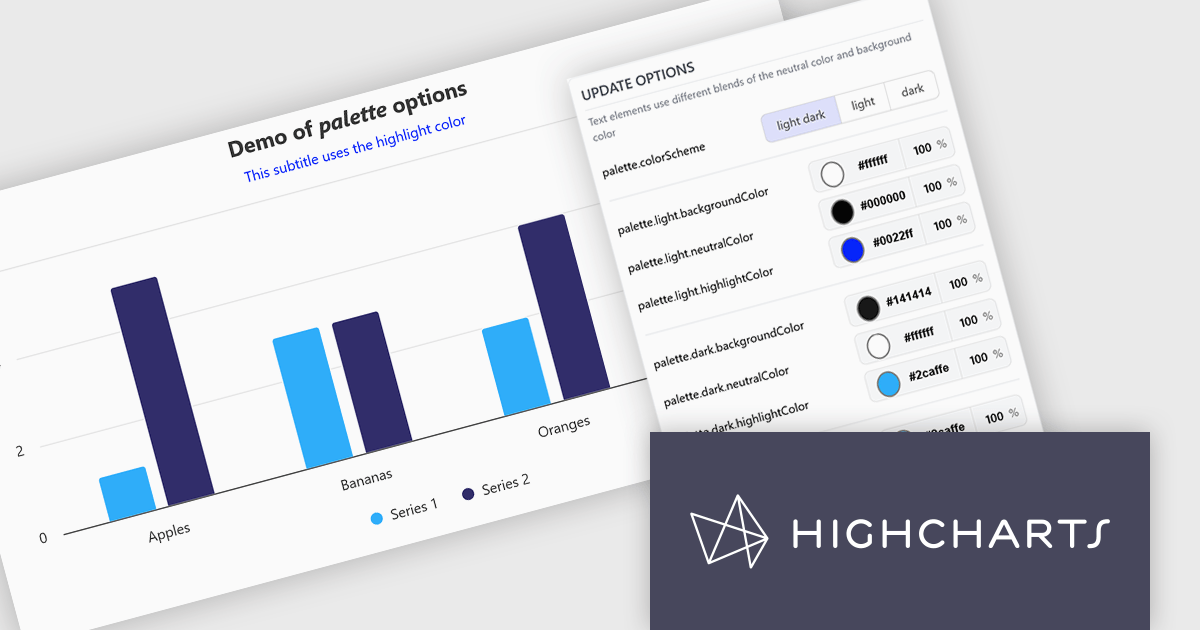
The Highcharts v13 update introduces a centralized color palette system that enables developers to define and manage chart colors, light and dark mode variations, and UI styling from a single configuration. By consolidating color settings across series, chart elements, and interactive states, it reduces repetitive configuration, simplifies brand consistency, and makes large chart collections easier to maintain. The addition of color scheme support and CSS variable exposure also allows charts to adapt more seamlessly to application themes and user preferences while providing greater flexibility for custom styling.
To see a full list of what's new in v13, see our release notes.
Highcharts Core is licensed on an annual or perpetual basis, OEM licenses, and Advantage Renewals. It is licensed per Developer and has several license options including Internal, SaaS, and Self Hosted. See our Highcharts Core licensing page for full details.
Learn more on our Highcharts Core product page.

For the past three years, ComponentSource and Jspreadsheet have worked together to provide developers with powerful spreadsheet and data management solutions for modern web applications. Jspreadsheet offers Excel like functionality for JavaScript, React, Angular, and Vue applications, helping teams create interactive data grids, forms, dashboards, and business applications that can handle large volumes of data with exceptional performance.
A key product in this collaboration is Jspreadsheet Pro, the brand’s flagship spreadsheet component. Featuring more than 400 built in formulas, advanced data handling capabilities, and extensive customization options, it enables developers to deliver familiar spreadsheet experiences directly within their web applications while maintaining full control over data integration and persistence.
This partnership helps ComponentSource differentiate its product offering by providing customers with a market leading spreadsheet solution that complements its extensive portfolio of developer tools. Through ComponentSource’s global sales, licensing, and support services, developers worldwide can easily discover, evaluate, purchase, and deploy Jspreadsheet Pro within their projects.
Learn more about Jspreadsheet.
전화 : 00798 14 800 6332
팩스 : +1 770 250 6199


