


공식 공급 업체
200 이상의 소프트웨어 개발처와 판매 계약을 맺은 공인 디스트리뷰터로서 합법적인 라이선스를 제공합니다.
모든 브랜드 보기.

Printing functionality in reporting controls allows users to generate physical or digital copies of reports directly from within the software, ensuring seamless access to formatted, ready-to-distribute documents. This capability is especially valuable in data-driven applications where users need to share insights in a standardized format, such as in financial, operational, or compliance reporting. With printing support, users can define how reports appear on paper or in PDF format, often choosing custom layouts, page sizes, or specific sections for export, all of which aid in producing polished and accessible presentations of data. By reducing the manual steps needed to prepare data for distribution, printing functionality helps streamline workflows and enhance the utility of reporting tools for both internal and external stakeholders.
Several React reporting controls offer printing support including:
For an in-depth analysis of features and price, visit our React Reporting controls comparison.

ONLYOFFICE Docs is a comprehensive online editor, allowing users to create text documents, spreadsheets, presentations, and forms. It enables your users to edit, share, and collaborate on documents online in their preferred browser, within your own application. It is fully compatible with OOXML (Office Open XML) formats and supports popular Microsoft Office and other document formats such as CSV, DOC, DOCX, EPUB, HTML, ODP, ODS, ODT, PDF, PPT, PPTX, RTF, TXT, XLS, and XLSX.
The ONLYOFFICE Docs v8.2 update adds support for performing iterative calculations. This enables formulas to be repeatedly recalculated until a specific, stable result is reached or a set number of attempts is made. By setting iteration limits and defining acceptable precision levels, iterative calculations enable users to control the number of recalculations, allowing the formula to reach an approximation or convergence point that serves as the final value. This process is particularly useful when dealing with circular references, where a formula refers to its own cell either directly or through a sequence of references involving other cells. Without iterative calculations, such formulas would produce errors, as they would require an infinite loop of recalculations. This is widely used in scenarios requiring complex dependencies, such as financial projections, engineering simulations, and scientific modeling.
To see a full list of what's new in v8.2.0, see our release notes.
ONLYOFFICE Docs is licensed by the number of simultaneous document connections and is available as an annual license with 1 year support and upgrades. See our ONLYOFFICE Docs licensing page for full details.
For more information, see our ONLYOFFICE Docs product page.
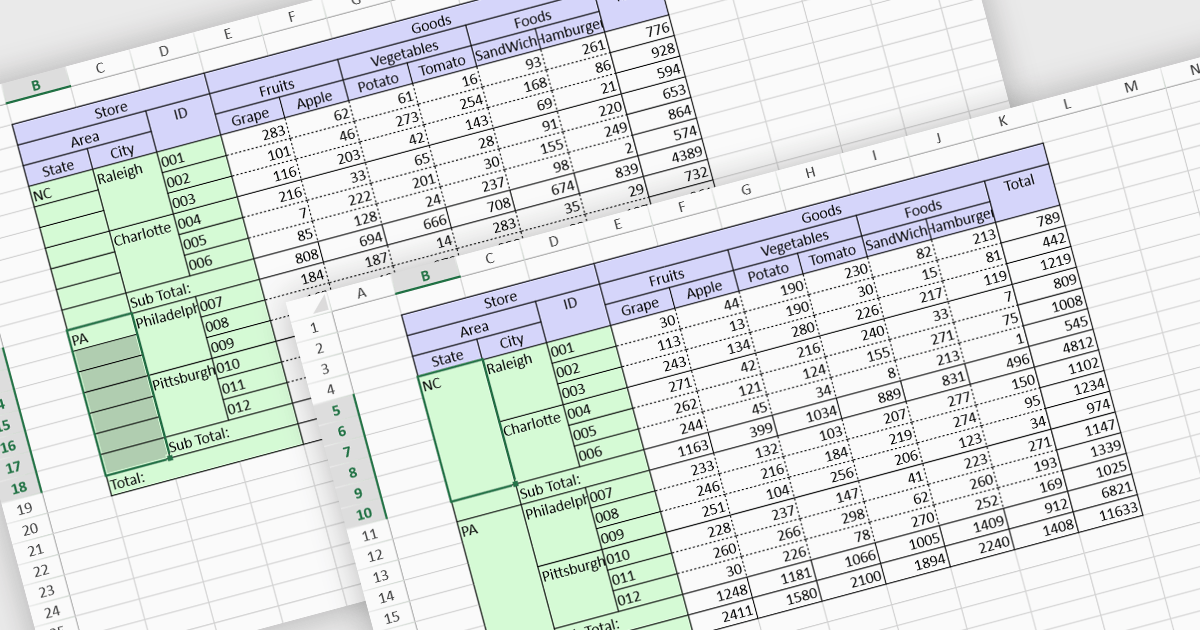
Cell merging is a spreadsheet feature that combines two or more adjacent cells into a single, larger cell, creating a unified space for data. This is particularly useful for creating visually organized and readable spreadsheets, allowing headers to span multiple columns or rows, enhancing clarity and alignment in complex data sets. By merging cells, users can create more structured layouts, making the data presentation cleaner and often easier to understand at a glance. For example, in financial reporting or project tracking sheets, merging cells can emphasize titles, group categories, or highlight specific sections of data, adding visual polish. It can also help when building dashboards, forms, and reports where visual hierarchy and structured information flow are essential for end-user readability and comprehension.
Several React spreadsheet controls offer the ability to merge cells including:
For an in-depth analysis of features and price, visit our React spreadsheet controls comparison.

Line annotations are digital markings that allow users to draw straight lines on documents. These lines can be used for various purposes, such as connecting related information, highlighting specific sections, or adding visual cues for reference. They are particularly useful for tasks that require comparison, measurement, or the creation of diagrams or flowcharts directly within the PDF.
Several React PDF viewer controls offer support for line annotations including:
For an in-depth analysis of features and price, visit our React PDF viewer controls comparison.

ActiveReportsJS by MESCIUS is a JavaScript reporting toolkit that empowers developers to design and embed interactive reports within web applications. It offers a standalone report designer for crafting reports and a JavaScript report viewer component for seamless integration into web frameworks like React or vanilla JavaScript. This solution streamlines report creation, facilitates data visualization, and delivers a user-friendly report experience.
The ActiveReportsJS 5.1 update introduces a Master Report feature, which improves report design efficiency by allowing developers to create reusable templates that define common elements such as headers, footers, and styles. Multiple reports can inherit shared components, reducing redundancy and simplifying maintenance. Developers can ensure consistency across reports and make global updates more efficiently, making it easier to scale for larger applications. Using a master report template is valuable in dynamic web applications, where maintaining uniform reporting structures is crucial for delivering a cohesive user experience.
To see a full list of what's new in 5.1, see our release notes.
ActiveReportsJS is licensed on an annual subscription or perpetual basis and is available as a Single Deployment License for non-commercial use, and as a Single Domain License or Unlimited Domain License for commercial and/or SaaS use. See our ActiveReportsJS licensing page for full details.
Learn more on our ActiveReportsJS product page.
전화 : 00798 14 800 6332
팩스 : +1 770 250 6199


