


공식 공급 업체
200 이상의 소프트웨어 개발처와 판매 계약을 맺은 공인 디스트리뷰터로서 합법적인 라이선스를 제공합니다.
모든 브랜드 보기.
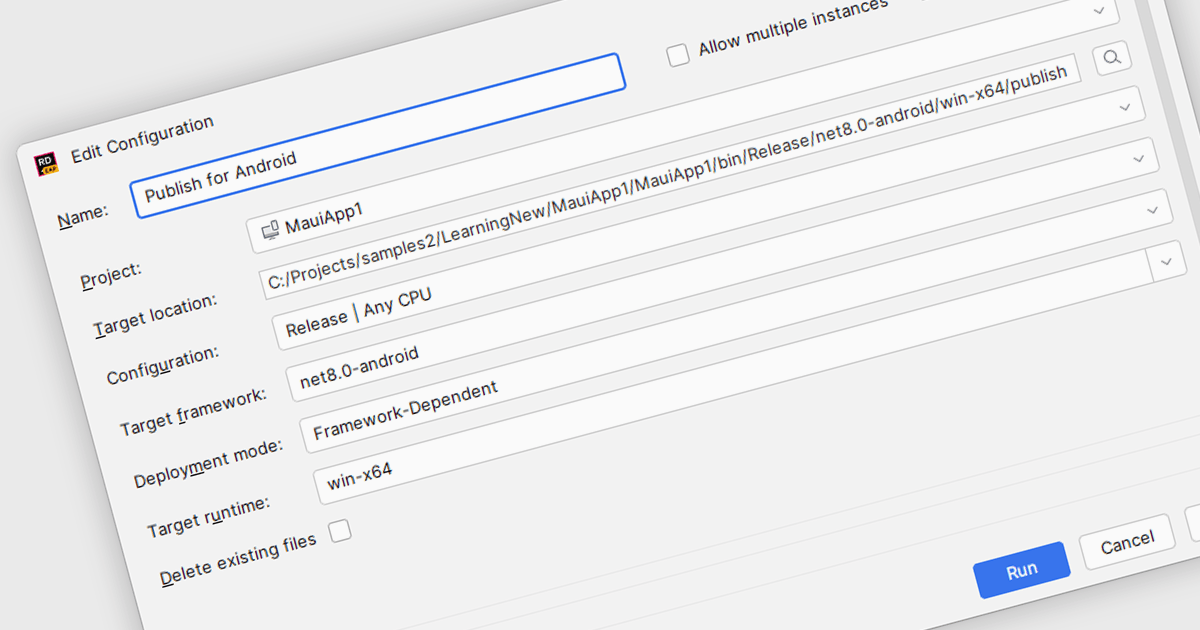
.NET MAUI (Multi-platform App UI) support in Integrated Development Environments (IDEs) provides developers with the necessary tools to build cross-platform applications using a single codebase. This support includes features such as project templates, device emulation, debugging utilities, UI design previews, and hot reload functionality. With these capabilities integrated into the IDE, developers can create, test, and refine applications for Android, iOS, macOS, and Windows within a unified development experience, reducing complexity and improving workflow efficiency across platforms.
Several IDEs offer support for .NET MAUI including:
For an in-depth analysis of features and price, visit our comparison of Integrated Development Environments (IDEs).
Syncfusion Essential Studio Enterprise provides a comprehensive collection of UI components and frameworks for building modern cross-platform applications. It offers over 1,800 components compatible with .NET WinForms, WPF, ASP.NET Core & MVC, WinUI, MAUI, JavaScript, Blazor, and more, enabling seamless application development across diverse devices and operating systems.
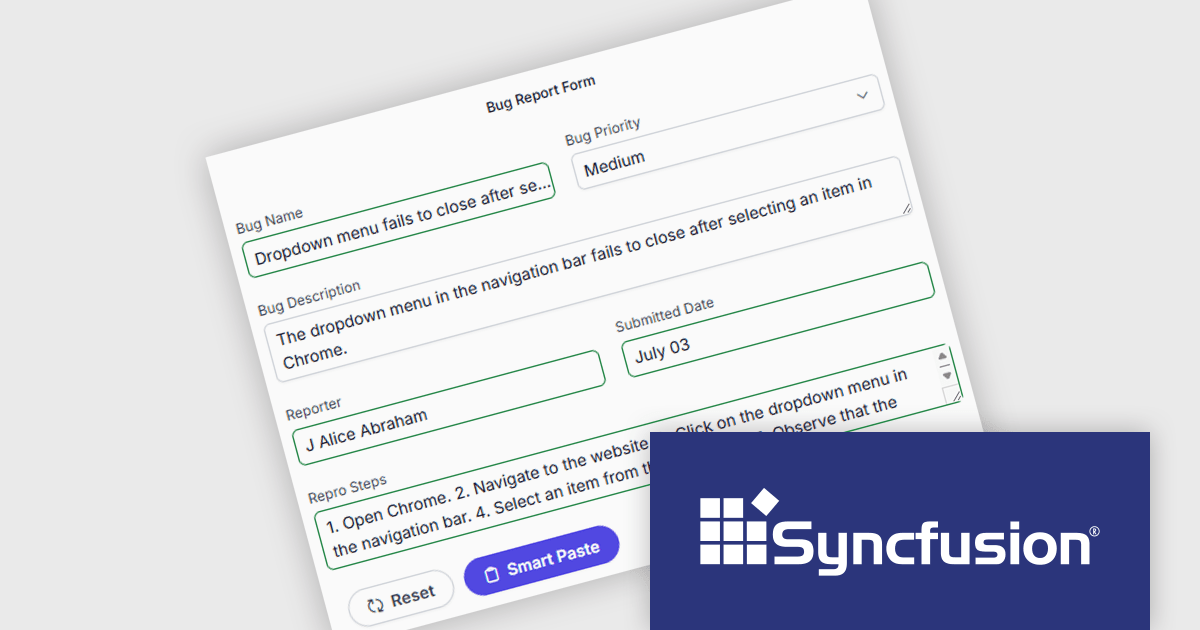
The Syncfusion Essential Studio Enterprise 2025 Volume 3 (31.1.17) release adds new Blazor Smart Paste Button and Smart TextArea components, embedding AI‑assisted intelligence directly in data entry workflows. The Smart Paste Button component analyzes clipboard content, such as structured forms, text snippets, or multi-field data, and pastes it intelligently into relevant form fields with proper formatting and mapping. Meanwhile, the Smart TextArea offers context-aware sentence‑level autocompletion, suggesting text continuations as users type to reduce keystrokes and improve writing consistency. Together, these components reduce user friction, speed up form filling, minimize input errors, and help developers deliver more polished, intelligent interfaces with less custom logic.
To see a full list of what's new in 2025 Volume 3 (31.1.17), see our release notes.
Syncfusion Essential Studio Enterprise is licensed per developer and is available as a 12 Month Timed Subscription License which includes support and maintenance. See our Syncfusion Essential Studio Enterprise licensing page for full details.
Learn more on our Syncfusion Essential Studio Enterprise product page.
Smart UI by Smart HTML Elements is an enterprise-grade UI library offering pre-built web components for developers in Angular, React, Vue, Blazor, and JavaScript. It boasts over 60 ready-to-use components like grids, charts, schedulers, and editors, all featuring two-way data binding, responsiveness, accessibility, and theming capabilities. This library helps developers rapidly build dynamic and modern web applications with consistent look-and-feel and rich functionalities, accelerating development time and ensuring professional quality.
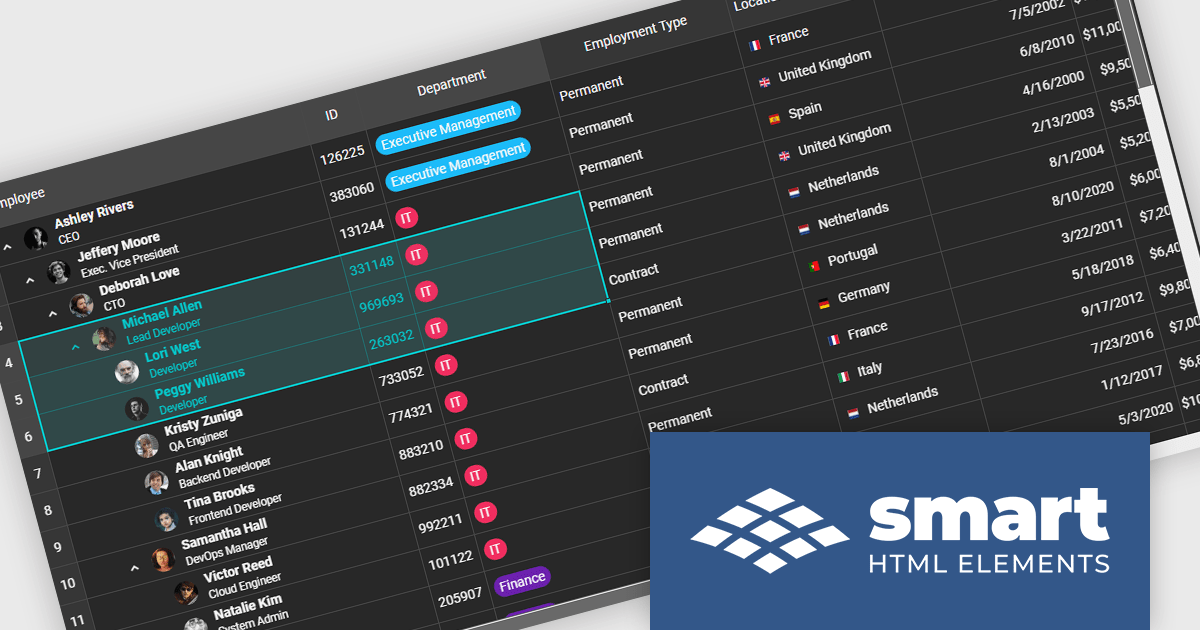
The Smart UI v24.0.0 release adds support for grid spreadsheet extensions which bring familiar spreadsheet‑style formatting and editing capabilities into the Smart UI grid component. Users can now apply formatting like bold, italic, underline, strike‑through, and set background or text colors directly in cells, much like working in Excel. These extensions also improve usability via selection behaviors, keyboard navigation, copy‑paste, and merging or spanning cells, making it easier for end users to manipulate tabular data without switching between tools. For developers and enterprises, these features mean reduced friction in building data‑heavy applications (dashboards, admin UIs, reporting tools), faster time to market since fewer custom implementations are required, and richer user experience for non-technical users accustomed to spreadsheet interfaces.
To see a full list of what's new in v24.0.0, see our release notes.
Smart UI (Smart HTML Elements) is licensed per developer and is available as a perpetual license with 1 year support and maintenance. It includes distribution to unlimited Web applications, SaaS projects, Intranets and Websites. Team, OEM and Enterprise licensing options are also available. See our Smart UI (Smart HTML Elements) licensing page for full details.
Learn more on our Smart UI (Smart HTML Elements) product page.
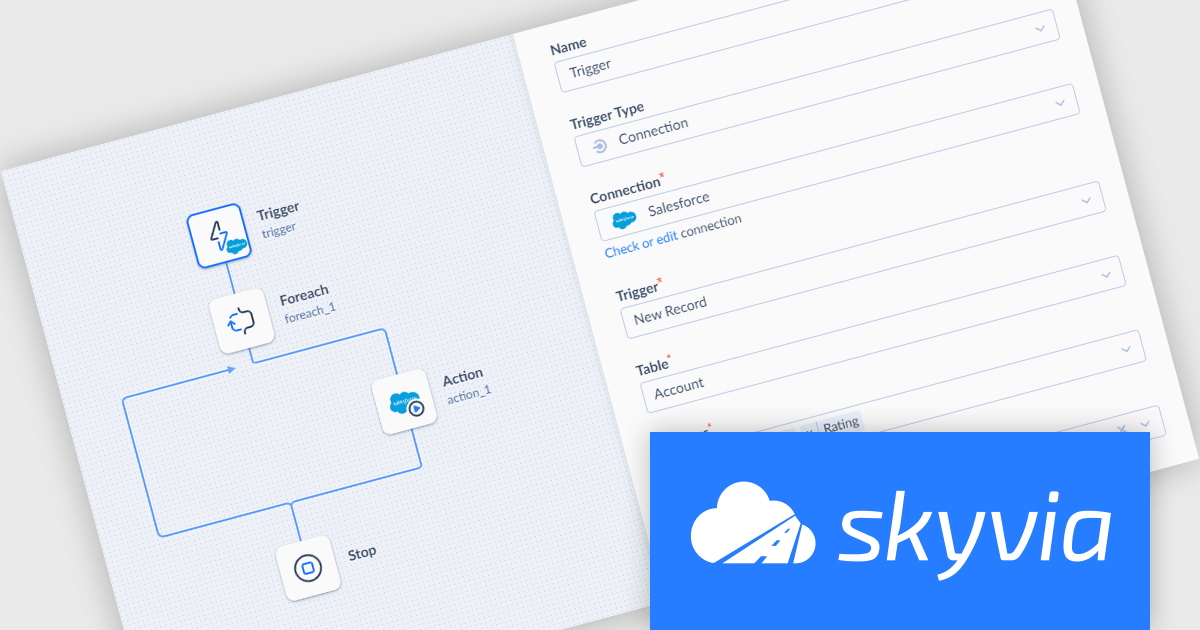
Skyvia Automation is a cloud-based platform that empowers businesses to streamline and automate repetitive tasks across various applications and data sources. By connecting different systems and triggers, users can create complex workflows, reducing manual labor and increasing efficiency. Its intuitive interface and extensive library of connectors make it a popular choice for automating data-driven processes.
The Skyvia Automation September 2025 release adds a new 'Updated Record' trigger for automations using the connection trigger type which fires when an existing record is modified. This enables more responsive and dynamic workflows: updates in source systems can automatically propagate downstream, ensuring synchronization, data consistency, and timely reactions (for example, alerting, auditing, or further processing). Organizations can now build automations that are more event-driven, not just reacting to new records but also to changes in existing ones. This reduces manual monitoring, minimizes latency in change detection, and improves operational efficiency.
To see a full list of what's new, see our release notes.
Skyvia Automation is licensed based on the number of tasks per month and is available as an Annual License. See our Skyvia Automation licensing page for full details.
Learn more on our Skyvia Automation product page.
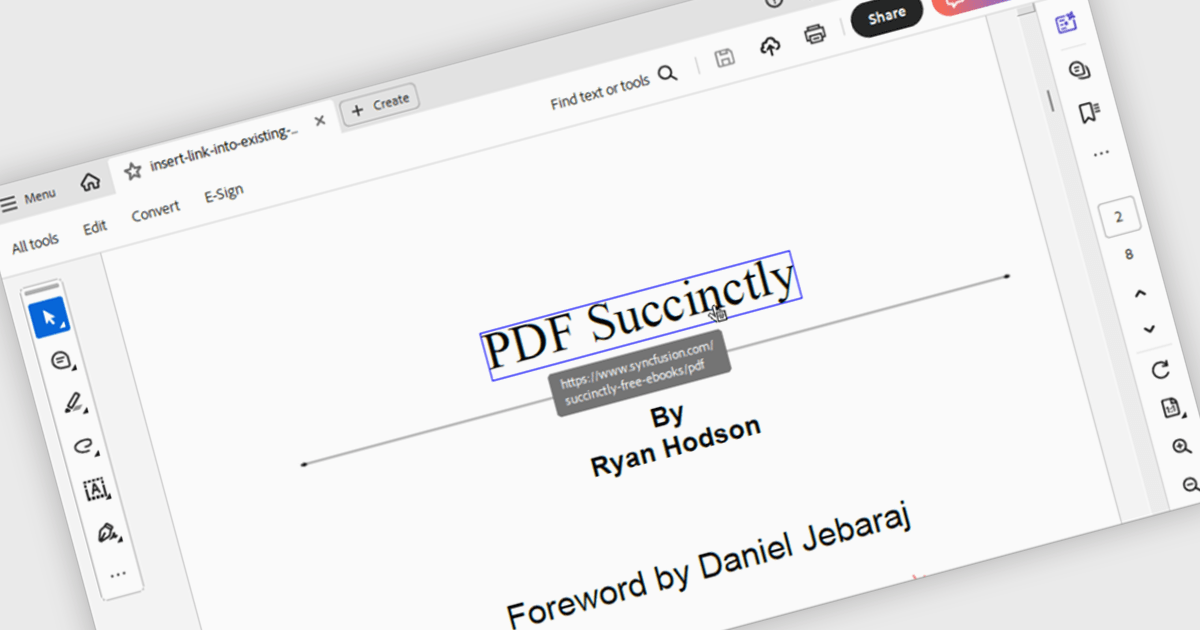
Hyperlink navigation in a PDF component refers to the ability to detect and interact with links embedded within a PDF document, allowing users to jump to external URLs, internal pages, or named destinations directly from the viewer. This functionality enhances the user experience by supporting transitions within or outside the document without manual scrolling or searching. For developers, it enables the creation of interactive documents and applications where navigation is intuitive, efficient, and consistent with modern document consumption expectations.
Several WinForms PDF components support hyperlink navigation, including:
For an in-depth analysis of features and price, visit our comparison of PDF components for WinForms.
전화 : 00798 14 800 6332
팩스 : +1 770 250 6199


