


공식 공급 업체
200 이상의 소프트웨어 개발처와 판매 계약을 맺은 공인 디스트리뷰터로서 합법적인 라이선스를 제공합니다.
모든 브랜드 보기.
Telerik UI for ASP.NET Core is a robust library of over 110 UI components designed for modern web applications. It offers high performance, scalability, and extensive customization to meet diverse requirements in data handling, UX, design, and accessibility. Key components like the Grid, Scheduler, Chart, and Editor enable intuitive data visualization and manipulation, making it ideal for applications ranging from interactive dashboards to complex enterprise solutions. With Telerik UI for ASP.NET Core, developers can create feature-rich, professional-grade applications with ease.
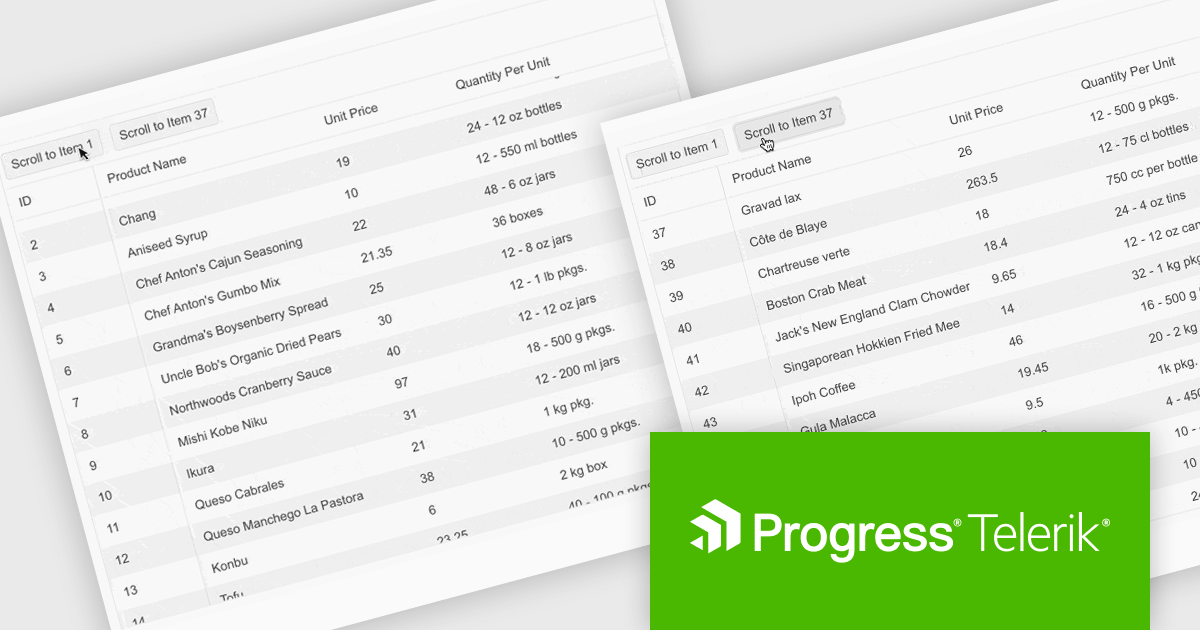
The Telerik UI for ASP.NET Core 2024 Q4 update introduces the "Scroll to Item" method, a powerful feature designed to streamline navigation within data-intensive grids. This method allows developers to programmatically direct users to specific rows based on their unique identifiers, enhancing usability and reducing the need for manual scrolling. It supports both standard and virtual scrolling scenarios, ensuring seamless performance even when the targeted row is not initially loaded by invoking a callback function to handle data retrieval. By simplifying access to critical data points, the "Scroll to Item" method improves the efficiency of user workflows, making it an essential tool for building intuitive, data-driven applications.
To see a full list of what's new in 2024 Q4, see our release notes.
Telerik UI for ASP.NET Core is licensed per user and is available as an annual license with a one year support subscription, which is available in three tiers: Lite, Priority or Ultimate. See our Telerik UI for ASP.NET Core licensing page for full details.
Telerik UI for ASP.NET Core is available individually or as part of the following products:
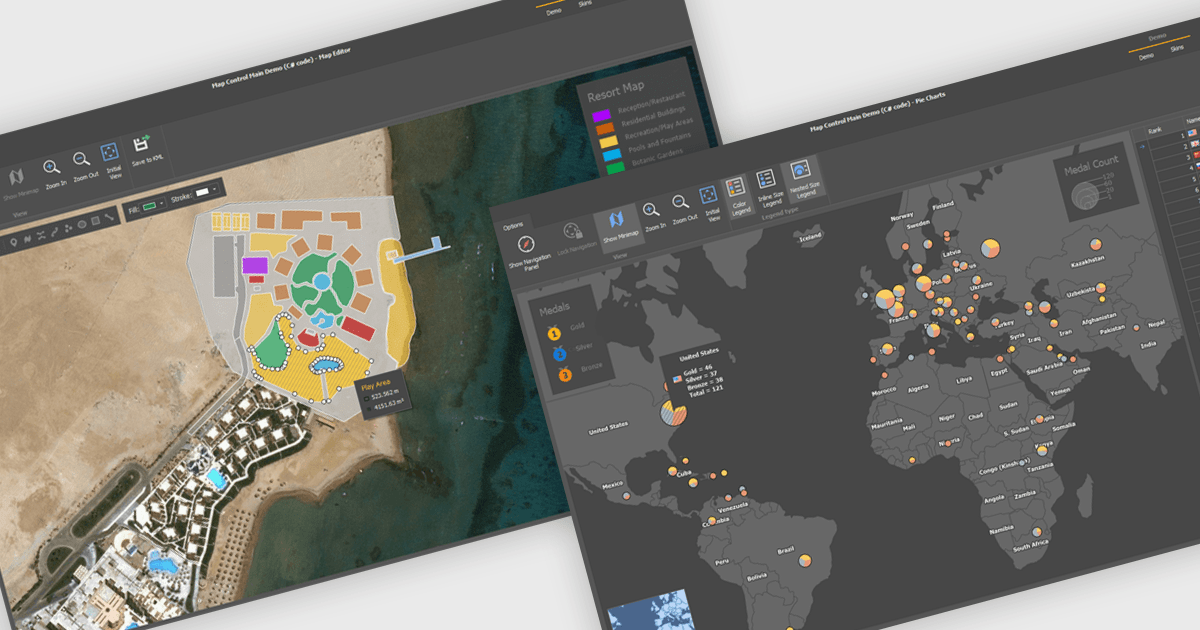
Maps are powerful tools for integrating geographic data and visualizations, enabling users to explore and understand information in a spatial context. With features like zooming, panning, and layering, maps provide an interactive way to analyze data and identify patterns. They support cross-platform compatibility, allowing consistent performance across devices, and can be customized to align with specific branding or design needs.
Several .NET WinForms UI suites offer map components including:
For an in-depth analysis of features and price, visit our comparison of .NET WinForms UI suites.

DevExtreme Complete is a robust suite of tools by DevExpress designed to streamline the development of high-performance web applications. It includes a wide range of UI components for modern frameworks such as Angular, React, Vue, and jQuery, making it ideal for developers aiming to create responsive, cross-platform applications with ease. With features like rich data visualization, interactive grids, form controls, and adaptive layouts, it empowers developers to deliver polished and user-friendly interfaces. Whether you're building enterprise dashboards or consumer-facing apps, DevExtreme Complete provides the flexibility and power to meet complex requirements while maintaining performance and usability.
The DevExtreme Chat Component (v24.2) introduces a versatile solution for integrating instant communication into web applications. It supports one-on-one and group interactions, AI and chatbot connectivity for intelligent support, and extensive customization options to create tailored user experiences. With features like typing indicators, popup integration, accessibility compliance, and internationalization, it offers a flexible and inclusive communication platform suitable for a wide range of scenarios, from customer support to team collaboration.
To see a full list of what's new in version 24.2, see our release notes.
DevExtreme Complete is licensed per developer and is available as a Perpetual License with a 12 month support and maintenance subscription. See our DevExtreme Complete licensing page for full details.
DevExtreme Complete is available to buy individually or as part of the following products:
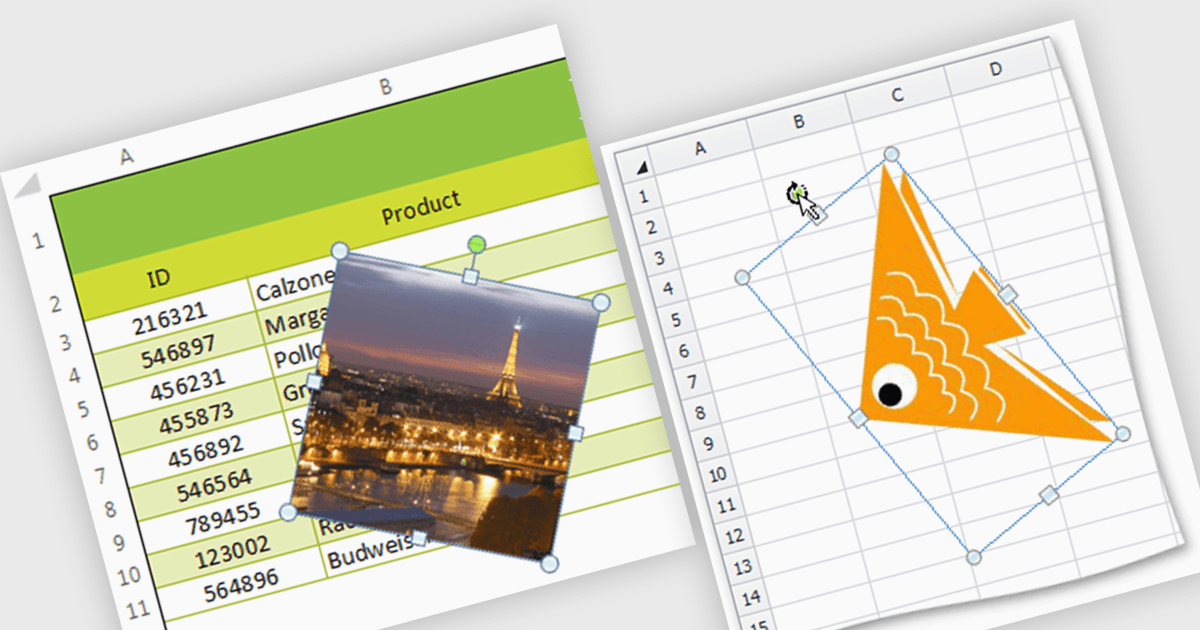
Image support within a spreadsheet component allows developers to seamlessly integrate and manipulate images directly within the spreadsheet environment, enabling features such as inserting, resizing, positioning, and formatting images within cells or as background elements. By embedding images alongside numerical or textual data, users can enhance data visualization, streamline report generation, and provide richer context for decision-making, ultimately improving communication and enabling more effective data analysis within applications.
Several WinForms spreadsheet components support inserting images, including:
For an in-depth analysis of features and price, visit our WinForms spreadsheet controls comparison.
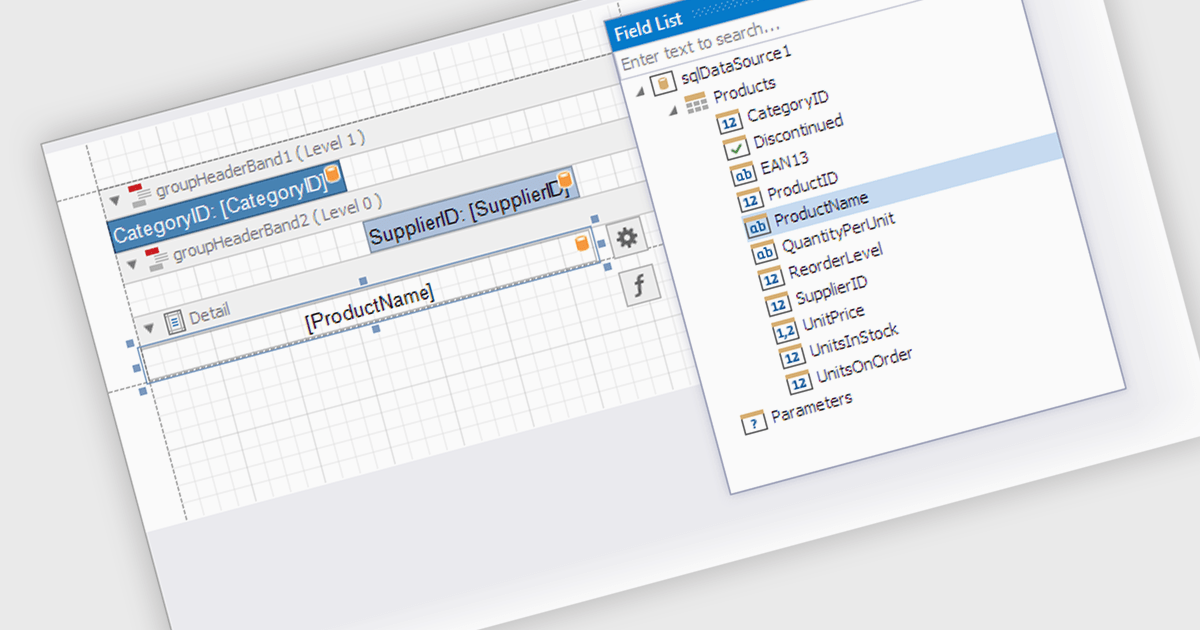
Data filtering and grouping in a .NET WPF reporting control are essential features that enable developers to organize, analyze, and present data effectively within an application. Data filtering allows users to specify criteria to display only relevant subsets of data, reducing noise and focusing on meaningful information. Grouping arranges data into categorized segments based on shared attributes, facilitating a structured and hierarchical view. These capabilities enhance user experience by making reports more intuitive and insightful while improving performance by minimizing data processing overhead. Together, filtering and grouping empower developers to create dynamic, user-friendly reports that meet diverse business requirements with precision and clarity.
Several .NET WPF reporting controls offer data filtering and grouping including:
For an in-depth analysis of features and price, visit our comparison of .NET WPF Reporting Controls.
전화 : 00798 14 800 6332
팩스 : +1 770 250 6199


