


공식 공급 업체
200 이상의 소프트웨어 개발처와 판매 계약을 맺은 공인 디스트리뷰터로서 합법적인 라이선스를 제공합니다.
모든 브랜드 보기.
TSplus Advanced Security is a comprehensive cybersecurity solution designed to protect application servers and remote desktops from cyber threats like malware, botnets, and online attacks. Featuring Hacker IP Protection, it uses community-driven intelligence to maintain a daily updated blacklist of verified malicious IPs, ensuring accurate and reliable defense. Seamlessly integrating with firewalls, it blocks unauthorized access and prevents disruptions caused by false positives. With automatic updates and one-click manual refresh options, it offers effortless protection. Ideal for IT administrators and businesses, TSplus Advanced Security ensures secure, uninterrupted operations and a safer remote work environment.
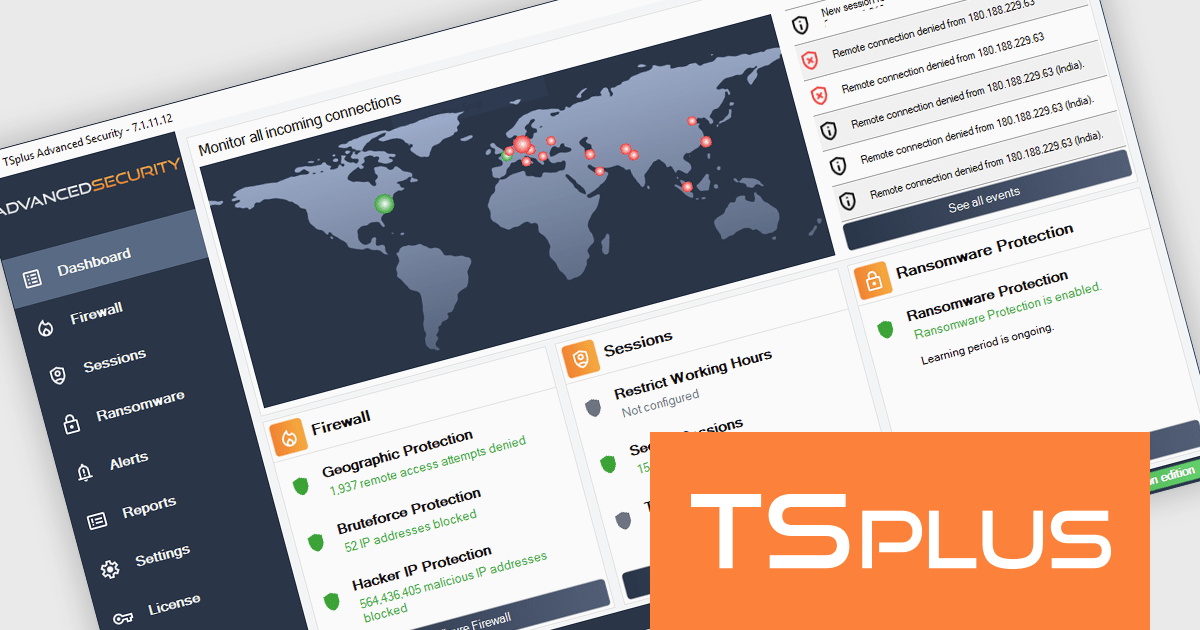
The TSplus Advanced Security V7.1 update introduces a Real-Time Threat Dashboard designed to provide software developers with immediate, actionable insights into potential security risks. By integrating a global map that visualizes the origins of attacks and displaying data from the last 100 failed connection attempts, this feature streamlines the process of identifying and analyzing threats. Developers can quickly assess vulnerabilities and take targeted actions to enhance system security, ensuring a more robust defense against unauthorized access and potential breaches. This update prioritizes efficiency and clarity, making threat management more effective and accessible.
To see a full list of what’s new in version 7.1, see our release notes.
TSplus Advanced Security is licensed per server, and is available in Essentials and Ultimate editions as a perpetual license with 1 year of updates and support. See our TSplus Advanced Security licensing page for full details.
For more information, visit our TSplus Advanced Security product page.
DataGrip is a multi-engine database environment that supports MySQL, PostgreSQL, Microsoft SQL Server, Oracle, Sybase, DB2, SQLite, HyperSQL, Apache Derby and H2. It includes an editor that provides intelligent coding assistance such as auto-completion, analysis and navigation. It also features a query console for running and profiling queries.
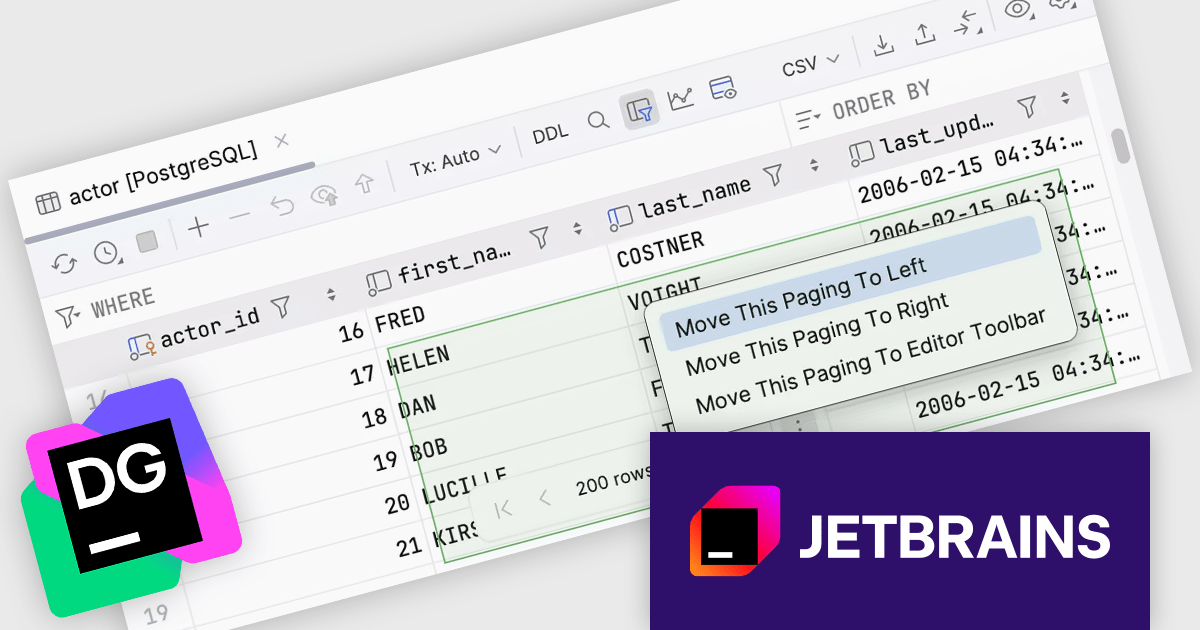
The JetBrains DataGrip 2024.3 release introduces a floating pagination toolbar, enhancing data navigation by repositioning the pagination controls to the bottom center of the data editor, making grid paging more visible and intuitive. This update improves workflow efficiency, especially when working with large datasets, by providing quick and centralized access to pagination. For users preferring traditional layouts, the control remains customizable, allowing it to be moved back to the toolbar through the IDE's settings. Ideal for database professionals who frequently manage extensive data grids, this feature ensures greater flexibility and a smoother user experience tailored to individual preferences.
To see a full list of what's new in version 2024.3, see our release notes.
DataGrip is licensed per user, and is available as a commercial annual subscription license. We can supply new subscriptions, subscription renewals (including continuity discounts), lapsed renewals, and additional user licenses. See our DataGrip licensing page for full details.
DataGrip is available to buy in the following products:
Skyvia Connect is a cloud-based integration platform that enables developers to connect and synchronize data between various applications and databases. It offers a flexible and scalable solution for building data pipelines and automating data workflows, supporting a wide range of data sources and formats. By providing a user-friendly interface and pre-built connectors, Skyvia Connect simplifies the process of integrating data systems, allowing developers to focus on core application development and data management tasks.
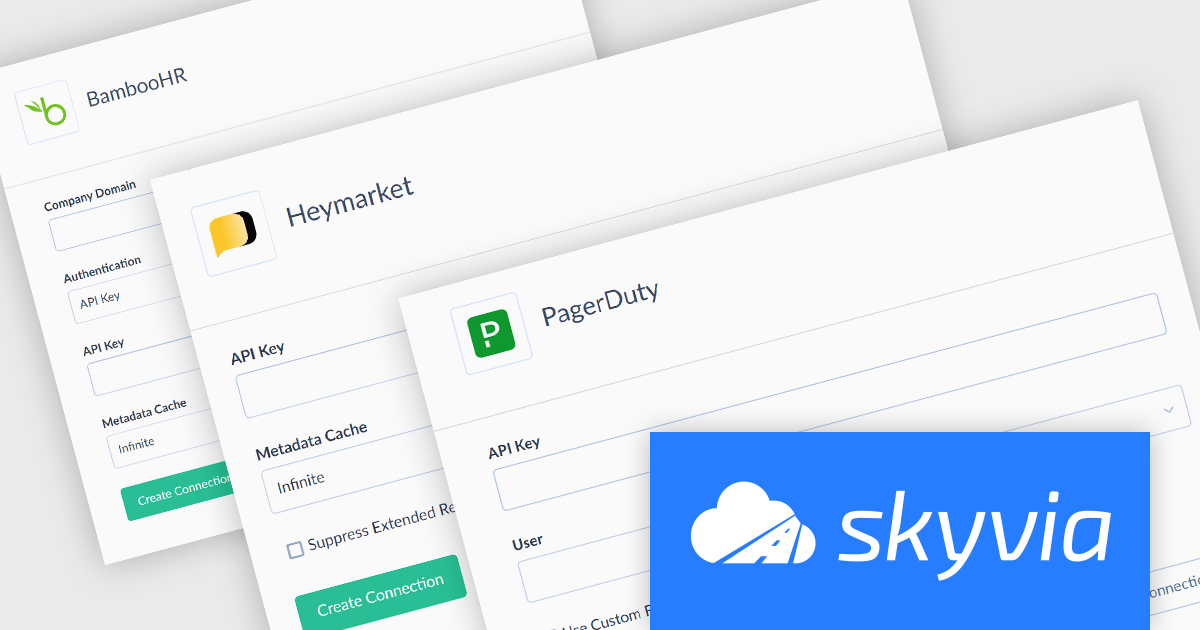
The latest release of Skyvia Connect adds new connectors for BambooHR, Heymarket, and PagerDuty. This enhancement enables seamless data integration for a broader range of business applications. These connectors cater to critical operational domains: BambooHR supports streamlined HR and employee data management, Heymarket enhances communication workflows through SMS and messaging, and PagerDuty improves incident management and operational reliability.
By integrating these tools, Skyvia Connect enables organizations to automate workflows, enhance collaboration, and derive actionable insights from interconnected systems, ultimately boosting productivity and decision-making across HR, communication, and IT operations.
To see a full list of what's new, see our release notes.
Skyvia Connect is licensed based on volume of traffic per month and is available as an Annual License. See our Skyvia Connect licensing page for full details.
Learn more on our Skyvia Connect product page.
GitKraken is a suite of developer tools built around Git, a popular version control system. It offers a graphical user interface (GUI) that allows developers to interact with Git repositories visually instead of relying on the command line. This simplifies complex Git workflows like resolving merge conflicts and visualizing code history, making Git more accessible and efficient for developers of all experience levels.
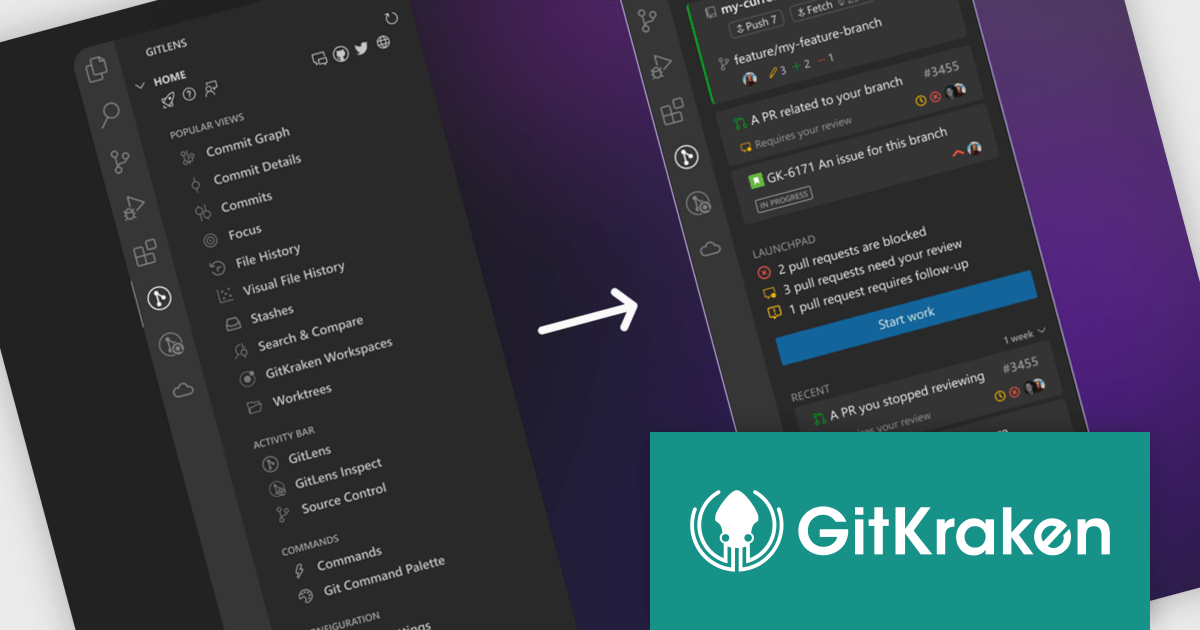
The GitLens for VS Code V16.0 release (available as part of GitKraken) adds a completely revamped Home view which includes an enhanced interface with distinct sections for streamlined workflows. The Active section provides real-time visibility into your current repository, branch, and repository state, along with quick actions for syncing (push, pull, fetch), switching repositories or branches, and reviewing working directory changes. The Launchpad section highlights pull requests requiring review, those blocked, or ready to merge, while offering tools to start new branches or worktrees, or to generate one from existing issues. A Recent section enables users to efficiently return to prior work by displaying recent branches, worktrees, and pull requests with activity within a selected timeframe.
To see a full list of what's new in V16.0, see our release notes.
GitLens for VS Code is available as part of GitKraken which is licensed per user as an Annual license with free updates and technical support. See our GitKraken licensing page for full details.
Learn more on our GitKraken product page.
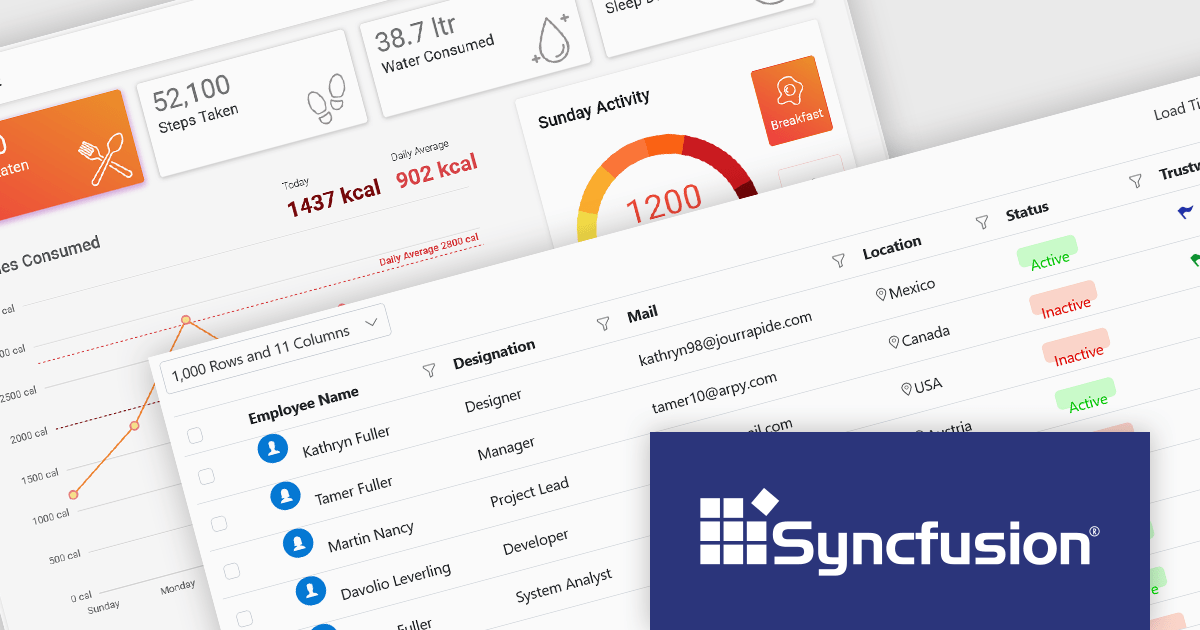
Syncfusion Essential Studio Enterprise provides a comprehensive collection of UI components and frameworks for building modern cross-platform applications. It offers over 1,800 components compatible with .NET WinForms, WPF, ASP.NET Core & MVC, WinUI, MAUI, JavaScript, Xamarin, Blazor, and more, enabling seamless application development across diverse devices and operating systems.
The Syncfusion Essential Studio Enterprise 2024 Volume 3 SP1 (27.2.2) release introduces full support for .NET 9, allowing developers to target the latest version of Microsoft's popular framework, and benefit from performance and security improvements. Syncfusion products for all supported .NET platforms, including .NET MAUI, ASP.NET Core, Blazor, Windows Forms, and WPF, are now compatible with Microsoft .NET 9.
To see a full list of what's new in 2024 Volume 3 SP1 (27.2.2), see our release notes.
Syncfusion Essential Studio Enterprise is licensed per developer starting with a Team License of up to five developers. It is available as a 12 Month Timed Subscription License which includes support and maintenance. See our Syncfusion Essential Studio Enterprise licensing page for further details.
Learn more on our Syncfusion Essential Studio Enterprise product page.
전화 : 00798 14 800 6332
팩스 : +1 770 250 6199


