













공식 공급 업체
200 이상의 소프트웨어 개발처와 판매 계약을 맺은 공인 디스트리뷰터로서 합법적인 라이선스를 제공합니다.
모든 브랜드 보기.
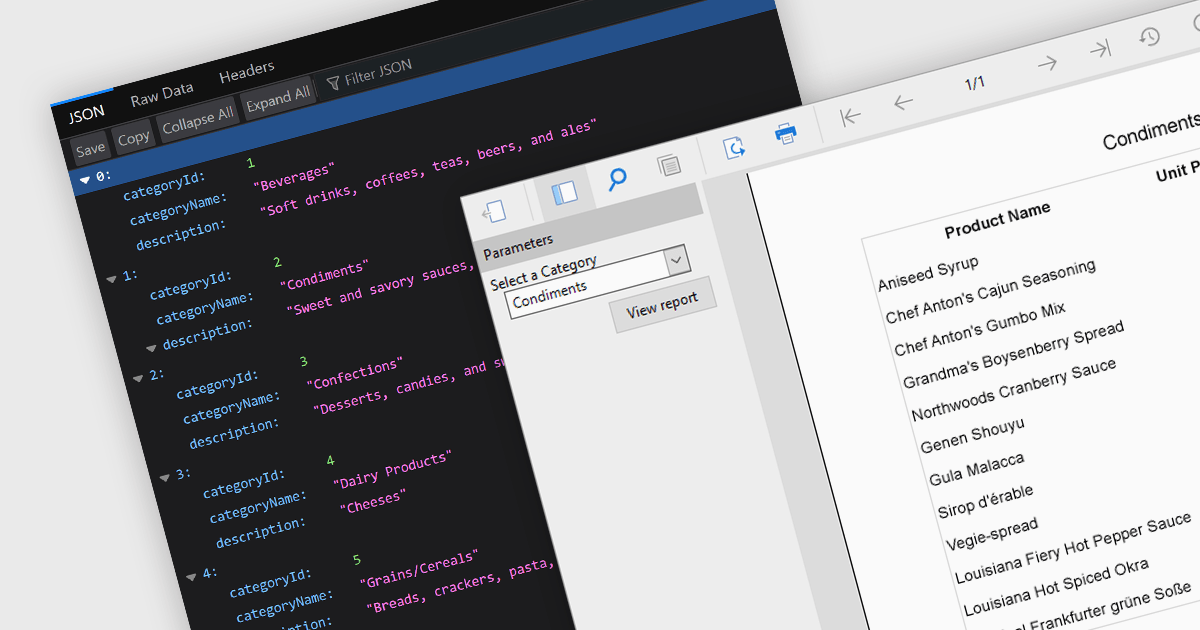
JSON support lets reporting tools directly use data in the human-readable JavaScript Object Notation format, unlocking flexibility, ease-of-use, and real-time insights. JSON enabled reports can directly consume diverse data, bypassing rigid schemas, thanks to the format's source-agnostic nature. This empowers developers with ease-of-use and efficiency, as JSON's readability simplifies integration and reduces code. Additionally, JSON seamlessly handles dynamic data, enabling real-time reporting for ever-changing insights.
Several ASP.NET Core reporting controls offer the ability to connect to JSON data sources including:
For an in-depth analysis of features and price, visit our ASP.NET Core Reporting Controls comparison.

Thumbnail navigation, a feature in many PDF readers, offers a visual and efficient way of browsing and switching between pages in a document. It presents miniature representations of each page, typically in a sidebar or panel, providing a visual overview of the document's content. It allows users to quickly scan content, identify sections, and jump directly to the desired page with a single click. This method is faster and more intuitive than scrolling or manually entering page numbers, making the information within the PDF more easily accessible.
Several PDF components for WPF offer thumbnail navigation including:
For an in-depth analysis of features and price, visit our WPF PDF Components for comparison.
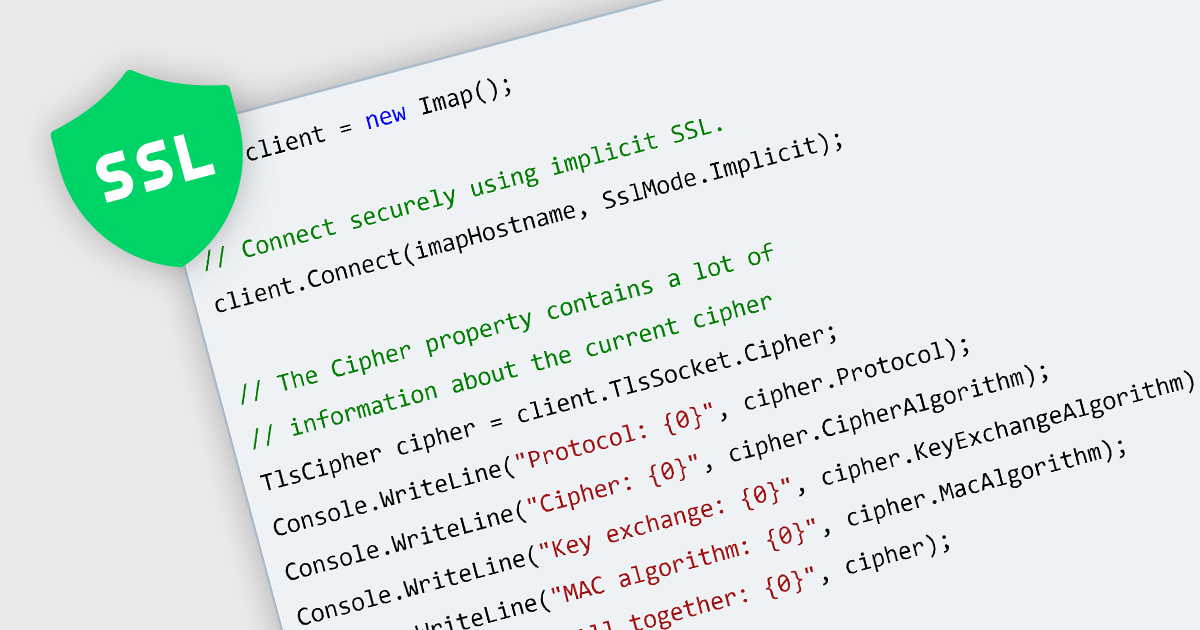
SSL (Secure Sockets Layer) is a cryptographic protocol that authenticates Internet connections and allows data encryption and decryption during network interactions. Communications components for .NET 8 with SSL support give full control over the SSL authentication process, including the ability to accept or reject certificates based on specific certificate parameters. This ensures the encryption of data transmitted between web servers and clients, enhancing data privacy, integrity, and authentication.
Several .NET 8 communications components include SSL support, such as:
For an in-depth analysis of features and price, visit our .NET 8 Communications and Messaging comparison.
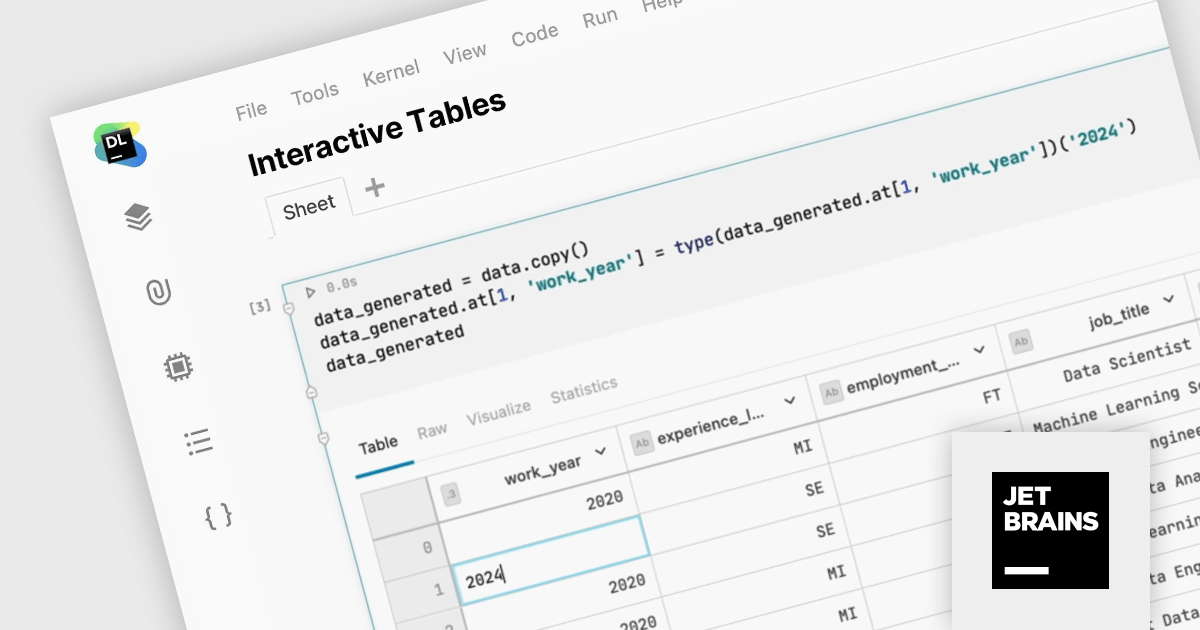
JetBrains Datalore is a collaborative data science platform that streamlines data exploration, analysis, and visualization through Jupyter-compatible notebooks. It empowers teams with features like automatic visualizations, pre-configured environments, interactive controls, and seamless collaboration functionalities. Datalore offers both cloud-based and self-hosted deployment options, catering to both individual and team-based data science workflows.
Version 2024.1 eliminates the need for intermediary CSV file manipulations with interactive DataFrame editing capabilities. Users can now directly modify cell values within the notebook environment and seamlessly export the resulting code, ensuring complete reproducibility and traceability.
To see a full list of what's new in version 2024.1, see our release notes.
Datalore is licensed per user, and is available as a commercial annual subscription license. See our Datalore licensing page for full details.
For more information, visit our Datalore product page.
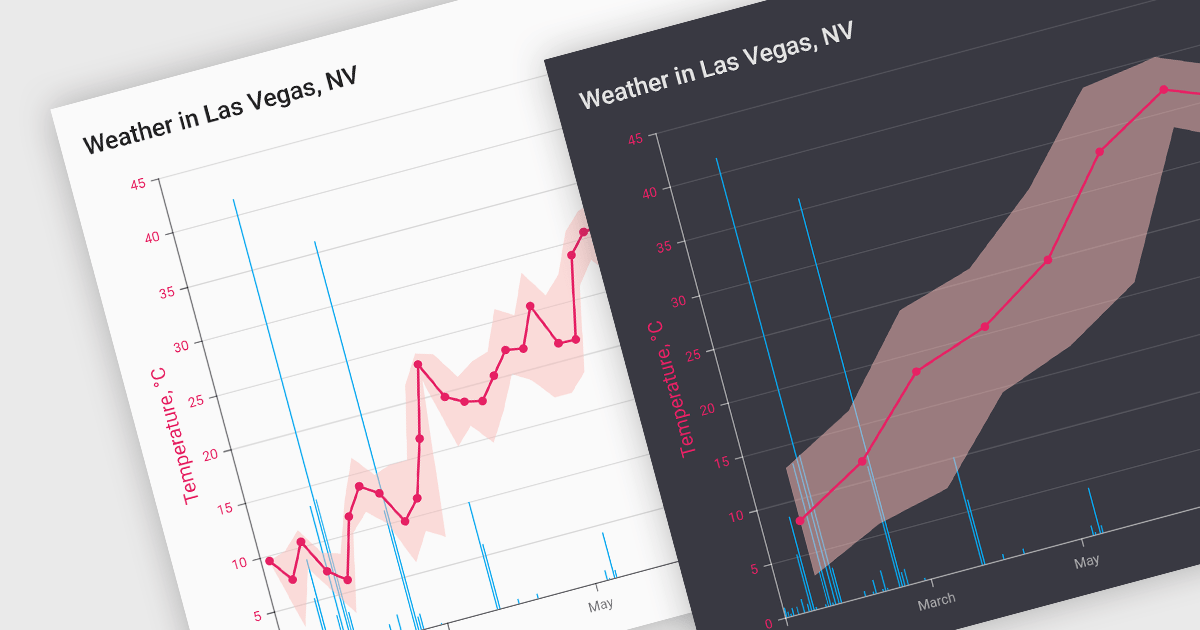
Data aggregation functionality in charts refers to the process of combining and summarizing raw data to provide a more concise and understandable representation. This technique involves collecting and grouping data points based on specific criteria, such as time intervals, categories, or geographic regions, and then calculating summary statistics, such as averages, totals, or percentages. The aggregated data is then used to create charts and graphs that offer a comprehensive overview of trends, patterns, or comparisons within the dataset. This approach helps in simplifying complex datasets and makes them more accessible for analysis, allowing decision-makers to derive meaningful insights and draw informed conclusions from the visual representation of aggregated information.
Several React chart controls support data aggregation including:
For an in-depth analysis of features and price, visit our React Chart Controls comparison.
전화 : 00798 14 800 6332
팩스 : +1 770 250 6199


