













공식 공급 업체
200 이상의 소프트웨어 개발처와 판매 계약을 맺은 공인 디스트리뷰터로서 합법적인 라이선스를 제공합니다.
모든 브랜드 보기.
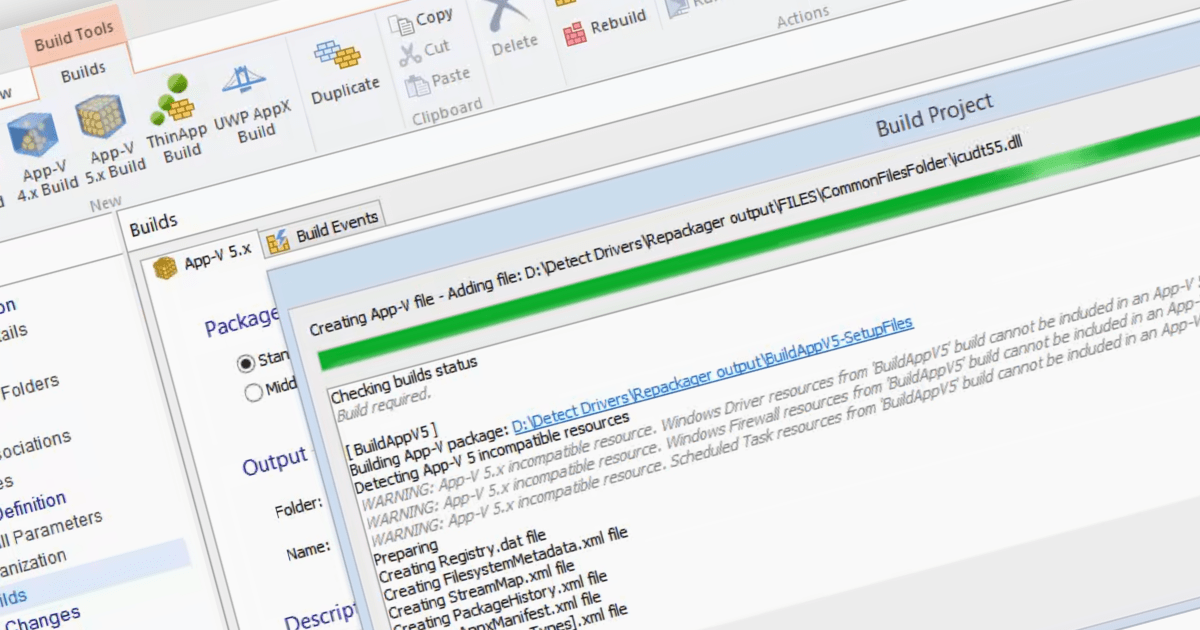
Microsoft App-V is an application virtualization solution that enables organizations to deploy applications to users without installing them directly on their computers. This is done by packaging the application into a virtual container that includes all of the application's files and dependencies. When a user launches the application, it is streamed from a central server to the user's computer. It reduces the time and effort required to deploy applications, avoids conflict between applications on the end user's machine, provides a centralized management console and improves security by keeping apps separate from each other.
Several Installation Tools support Microsoft App-V including:
For an in-depth analysis of features and price, visit our Installation Tools comparison.
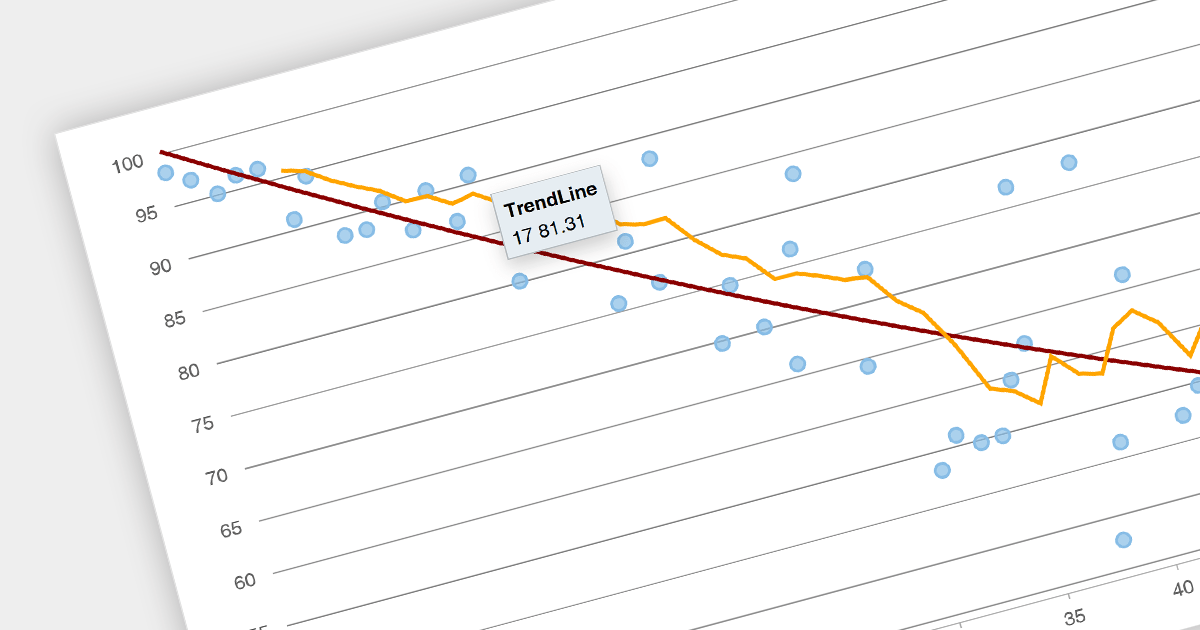
Trend lines are a chart feature used to indicate patterns or trends in data over time. Common examples include linear, exponential, polynomial, logarithmic, and moving average. Trend lines are crucial for making predictions or understanding the direction of data points in scatter plots and line charts, helping make data-driven decisions.
Several Angular chart components provide trend line support including:
For an in-depth analysis of features and price, visit our Angular Chart Component comparison.
Several Progress Telerik and Kendo products have increased in price effective December 1, 2023. The new pricing for each product is shown below:
| Product | Previous SRP* (from) | New SRP** (from) |
| Kendo UI | $899 | $1,049 |
| KendoReact | $799 | $899 |
| Telerik DevCraft UI | $1,299 | $1,499 |
| Telerik DevCraft Complete | $1,499 | $1,699 |
| Telerik DevCraft Ultimate | $2,199 | $2,199 (no change) |
| Telerik JustMock | $399 | $499 |
| Telerik Report Server | $1,399 | $1,499 |
| Telerik Reporting | $599 | $699 |
| Telerik UI for .NET MAUI | $899 | $999 |
| Telerik UI for ASP.NET AJAX | $899 | $999 |
| Telerik UI for Blazor | $899 | $999 |
| Telerik UI for WinForms | $899 | $999 |
| Telerik UI for WPF | $899 | $999 |
*SRP = Suggested Retail Price until November 30, 2023.
**SRP = Suggested Retail Price from December 1, 2023.
Log on to ComponentSource and visit the links above to see your personalized discounted prices in your preferred currency. Prices shown are starting prices with Lite Support where applicable.
Telerik UI for Xamarin and Telerik UI for WinUI are now available as part of a Telerik DevCraft product bundle, such as DevCraft Complete or DevCraft Ultimate.
The following products are no longer available: Kendo UI + Telerik UI for JSP, Kendo UI + Telerik UI for PHP, Telerik UI for Silverlight, Telerik UI for UWP.
TeamCity is a versatile CI/CD tool that empowers teams to implement seamless continuous integration, continuous delivery, and continuous deployment within their DevOps workflows.
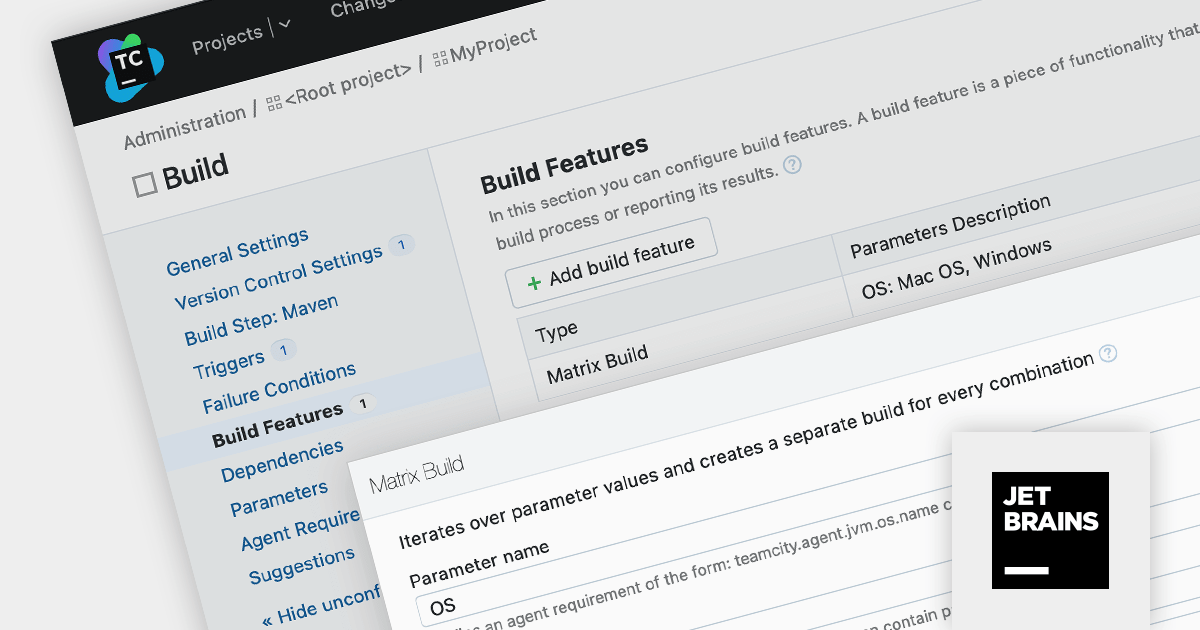
TeamCity Version 2023.11 introduces Matrix Builds, a dynamic build system that generates separate builds based on varying configuration parameters. Each unique parameter combination triggers a distinct build configuration, forming a matrix of individual builds that run independently.
Matrix Builds are particularly advantageous for testing software across diverse configurations, such as operating systems or browser versions. By defining a matrix of build configurations, you can execute the same test suite across multiple parameter combinations within a single build configuration, streamlining the review process and facilitating the resolution of compatibility issues.
To see a full list of what's new in version 2023.11, see our release notes.
For more information, visit our TeamCity product page.
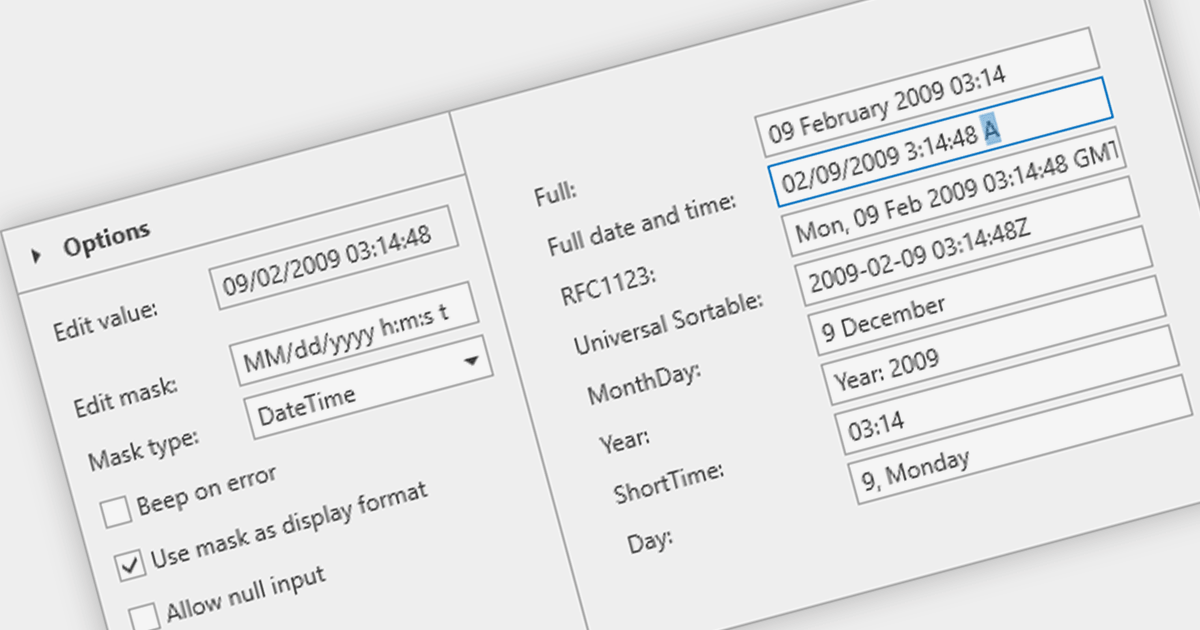
A masked text box is a data editor that requires the user to input data in a specific format. This control is particularly useful in forms where consistency and accuracy of data are critical, such as phone numbers or social security numbers. The mask ensures that the input conforms to a predefined pattern, reducing errors and streamlining data entry processes.
Several WPF data editor components provide masked input text boxes including:
For an in-depth analysis of features and price, visit our WPF Data Editors comparison.
전화 : 00798 14 800 6332
팩스 : +1 770 250 6199


