


공식 공급 업체
200 이상의 소프트웨어 개발처와 판매 계약을 맺은 공인 디스트리뷰터로서 합법적인 라이선스를 제공합니다.
모든 브랜드 보기.
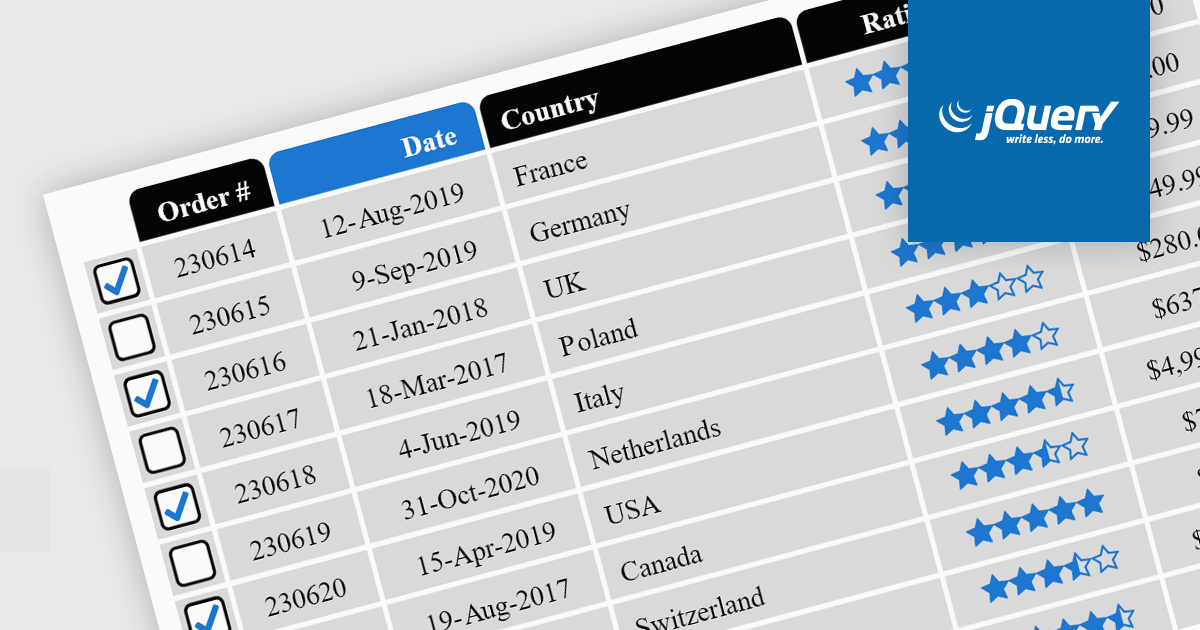
Cell types in Grid components are specialized configurations that define how data is displayed, edited, and interacted with within a grid or table structure. They allow developers to tailor the presentation and functionality of each cell to better match the type of data it contains. By specifying cell types such as text, numeric, date/time, and more, Grid components can provide intuitive controls and formatting automatically, streamlining data entry and reducing errors.
Common features include:
For an in-depth analysis of features and price, visit our jQuery grid components comparison.

Data grids are essential components in modern user interface (UI) suites, enabling developers to display, manage, and manipulate large sets of data efficiently. They provide features such as sorting, filtering, grouping, and pagination, which enhance the user experience and improve data navigation. Advanced data grids also support customizable templates, responsive layouts, and integration with various data sources, making them highly versatile for enterprise-level applications.
Several Blazor UI suites offer data grid components including:
For an in-depth analysis of features and price, visit our Blazor UI suites comparison.
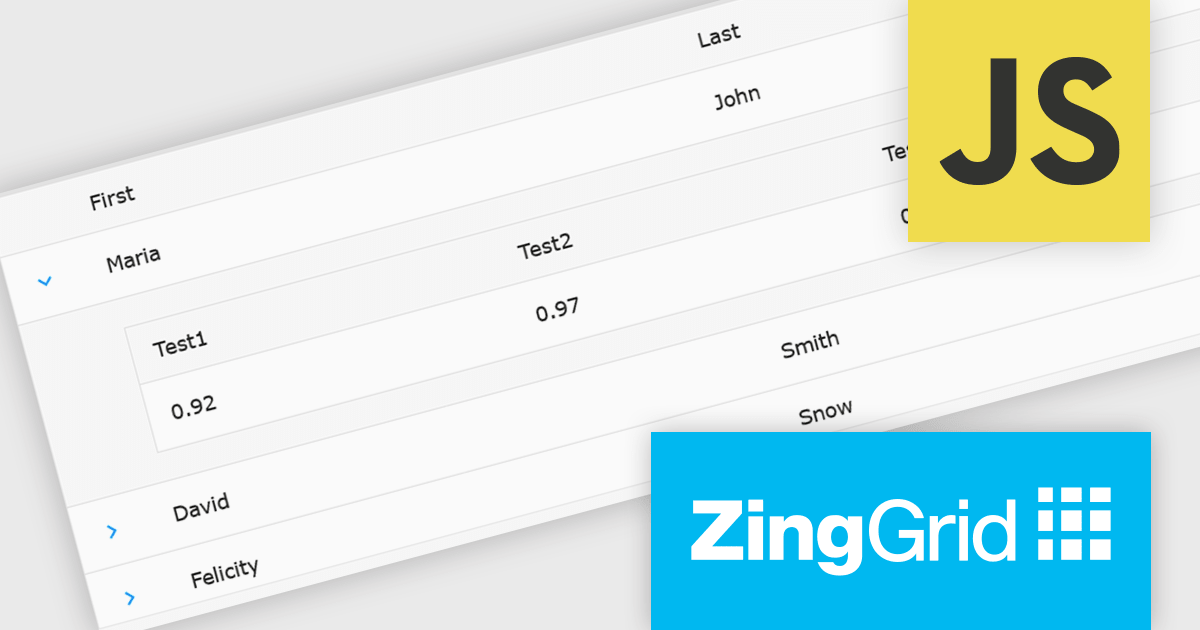
ZingGrid is a JavaScript library that simplifies the creation of interactive data tables and grids within web applications. Utilizing modern web components and focusing on performance and responsiveness, ZingGrid allows developers to implement features like searching, filtering, pagination, and in-line editing with minimal coding. This empowers efficient data visualization and manipulation for users, making it a valuable tool for web development.
The ZingGrid 2.0.0 release adds new Row Details feature that enhances data presentation by allowing users to expand individual rows and reveal supplementary information. This functionality provides a clean and organized way to display additional data without cluttering the main grid view. Whether you are editing, filtering, searching, or sorting your data, the expanded/collapsed state of each row is intelligently preserved, even across pages. This allows users to maintain context and easily access detailed information without losing their place or having to re-expand rows after interacting with other grid functionalities.
To see a full list of what's new in version 2.0.0, see our release notes.
ZingGrid is available as either a Single-Domain Website or Multi-Domain SaaS license. See our ZingGrid licensing page for full details.
For more information, visit our ZingGrid product page.
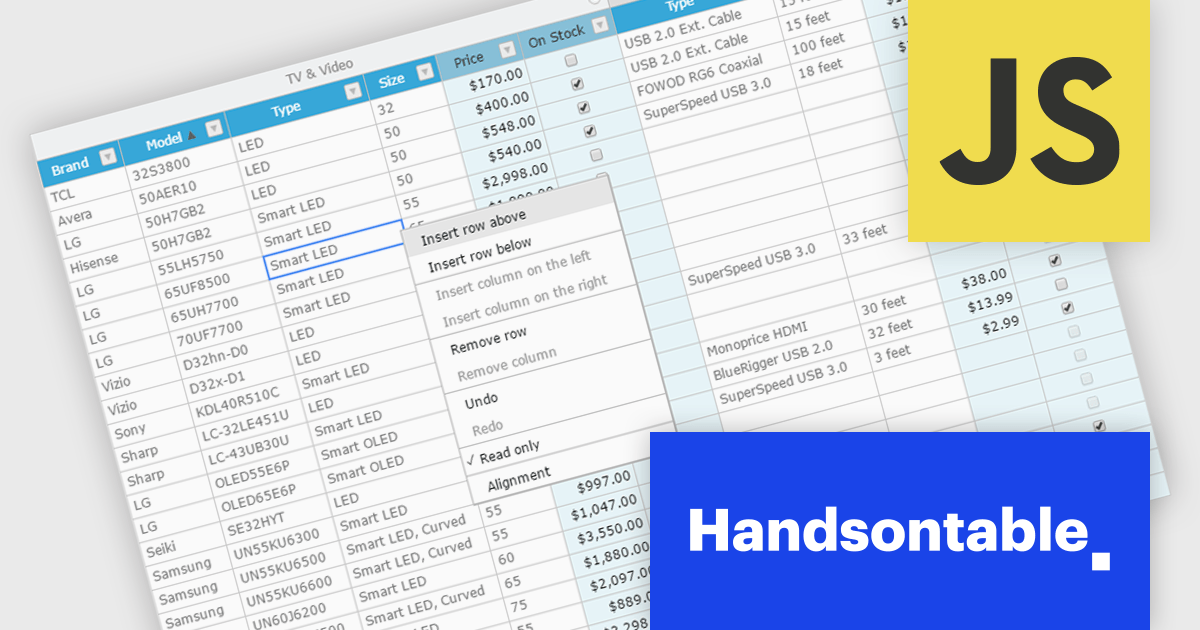
Handsontable is a JavaScript library designed to help developers build interactive data grids into their web applications. Offering a familiar spreadsheet-like interface, it allows users to edit, sort, and filter data with ease. Highly customizable and compatible with popular frameworks like React and Angular, Handsontable empowers developers to build robust data manipulation features into their web applications.
The Handsontable 15.1.0 update enhances table rendering efficiency by reusing and caching cell nodes instead of creating them from scratch during each rendering cycle. This reduces unnecessary DOM manipulations, leading to faster updates, improved responsiveness, and smoother interactions, particularly when handling large datasets. By optimizing how cells are managed, this update minimizes performance bottlenecks, allowing applications to render complex tables more efficiently while maintaining a seamless user experience.
To see a full list of what's new in version 15.1.0, see our release notes.
Handsontable is licensed per developer and is available as an Annual or Perpetual license with 1 year support and maintenance. See our Handsontable licensing page for full details.
For more information, visit our Handsontable product page.
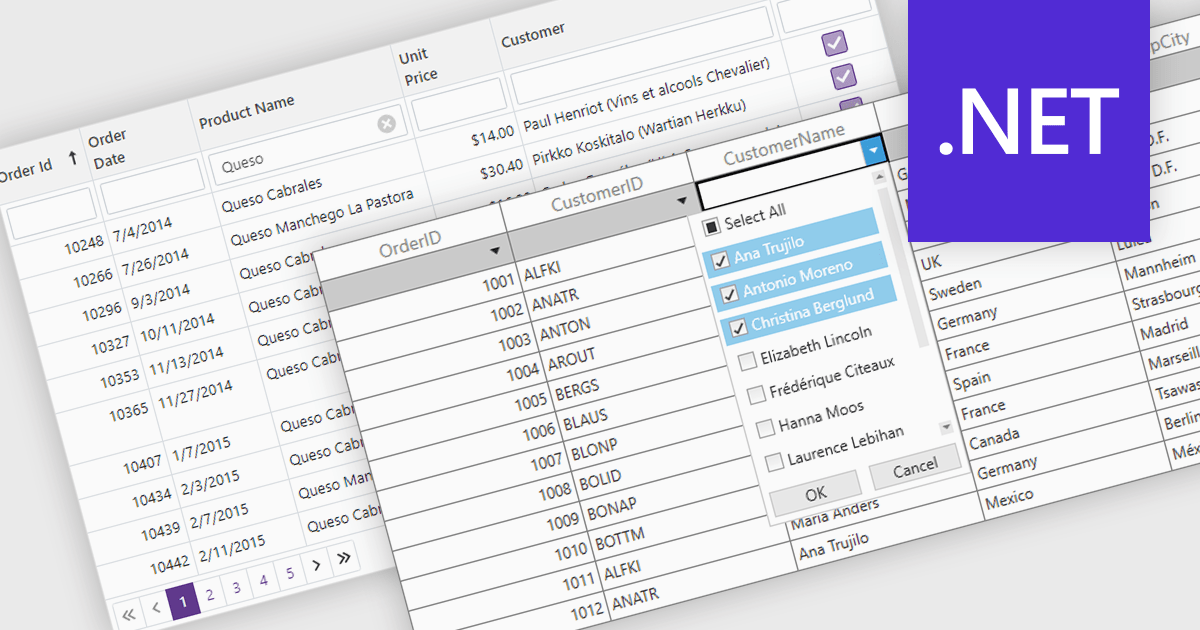
The Filter Rows feature in grids enables users to refine large datasets quickly with real-time filtering directly in the grid interface. It enhances productivity by reducing the need for manual searches, improves accuracy with precise filtering options, and streamlines workflows in .NET applications such as WinForms, WPF, and ASP.NET Core. By allowing users to filter data by text, numbers, dates, and boolean values, it simplifies data exploration and helps surface relevant information faster. This feature is especially useful in financial dashboards for transaction filtering, inventory management for quick product lookups, and CRM systems for refining customer records, making data handling more efficient and intuitive.
Several .NET grid controls offer filter row functionality including:
For an in-depth analysis of features and price, visit our comparison of .NET Grid Controls.
전화 : 00798 14 800 6332
팩스 : +1 770 250 6199


