


공식 공급 업체
200 이상의 소프트웨어 개발처와 판매 계약을 맺은 공인 디스트리뷰터로서 합법적인 라이선스를 제공합니다.
모든 브랜드 보기.
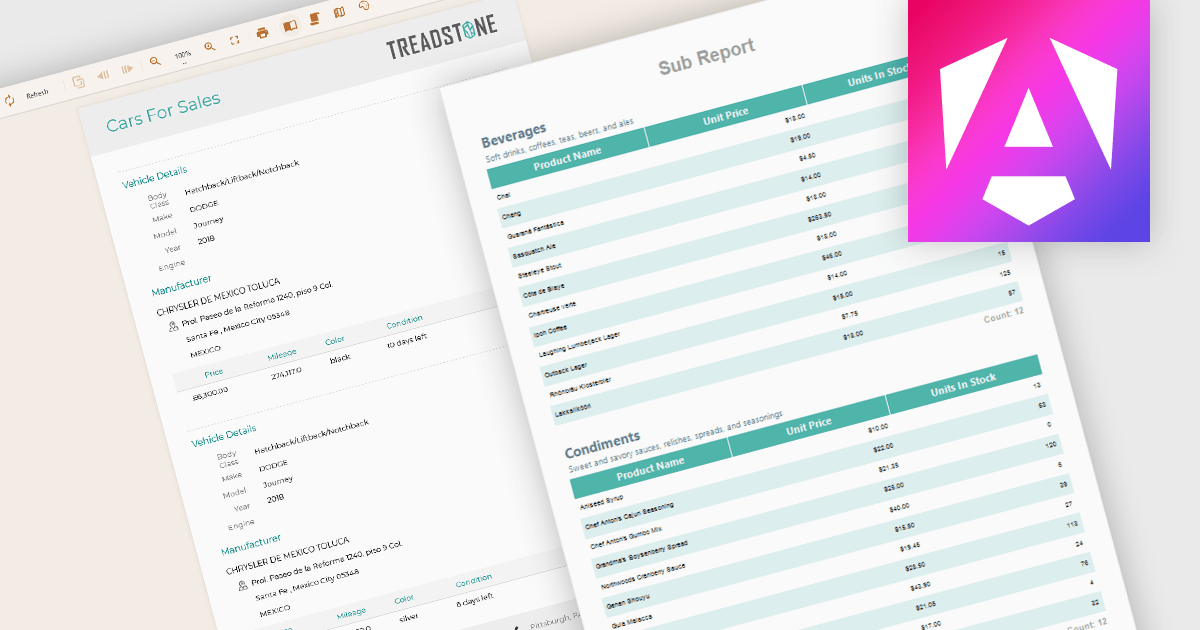
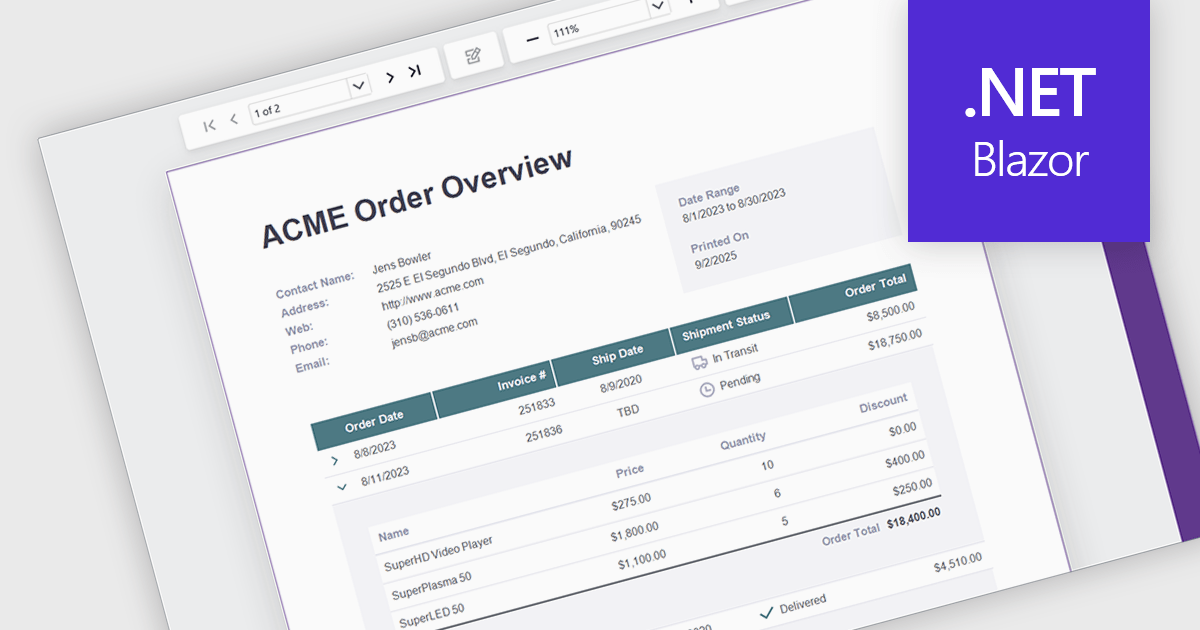
A subreport in a report component is a report embedded within another report, designed to present related or supplementary data that may not fit naturally into the main report’s structure. It is typically used when displaying hierarchical, grouped, or master-detail relationships, such as showing order items within a customer order summary. Subreports can be independently designed and then linked to the main report using parameters or shared data sources. This modular approach improves report organization and reusability, especially when similar data blocks are needed across multiple reports or sections within a complex reporting solution.
Several Angular Reporting controls offer support for subreports including:
For an in-depth analysis of features and price, visit our Angular Reporting controls comparison.
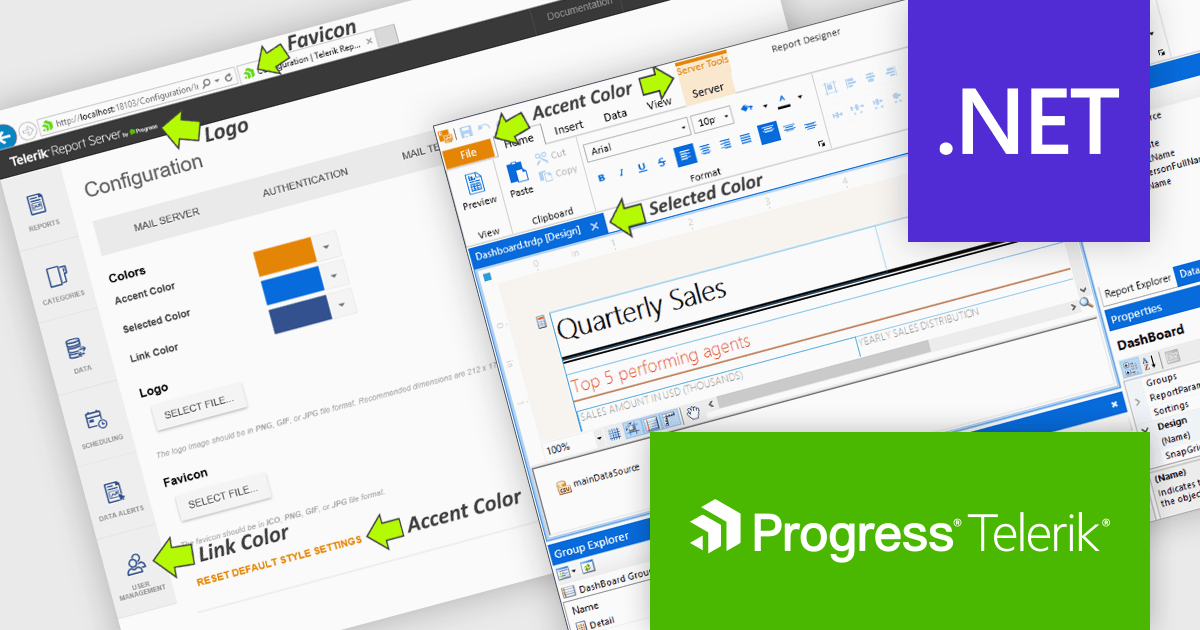
Telerik Report Server is a comprehensive and flexible end-to-end solution for managing reports. Built with the Telerik Reporting library, it is a server-based Windows web application that provides centralized storage, organization, and previewing of reports, along with features for scheduling, delivery, and user management. Report Server can act as a standalone solution or be integrated within an application, allowing developers to create, manage, and distribute reports across multiple platforms including Blazor, Angular and Windows Forms.
The Telerik Report Server 2025 Q3 update introduces white-labeling, allowing development teams to align the Report Server web application and Standalone Report Designer with their organization’s visual standards. This capability enables administrators to replace default branding elements such as colors, logos, and favicons with enterprise-specific assets, creating a consistent user interface across internal systems. By integrating into existing environments, the update helps reduce visual fragmentation, improve user trust, and improve the experience for both internal and external stakeholders.
To see a full list of what's new in 2025 Q3 (11.2.25.813), see our release notes.
Telerik Report Server is licensed per developer and has two licensing models: an annual Subscription License and a Perpetual License. The Subscription license provides access to the latest product updates, technical support, and exclusive benefits for a flat annual fee, and must be renewed to continue using the software. The Perpetual license is a one-time purchase granting access to the current released version and includes a one-year subscription for product updates and technical support. After this initial period, users can choose to renew the subscription element to continue receiving updates and support; otherwise, they may continue using the installed version available during their active subscription term but will forgo future updates and support. See our Telerik Report Server licensing page for full details.
Telerik Report Server is available individually or as part of Telerik DevCraft Ultimate.
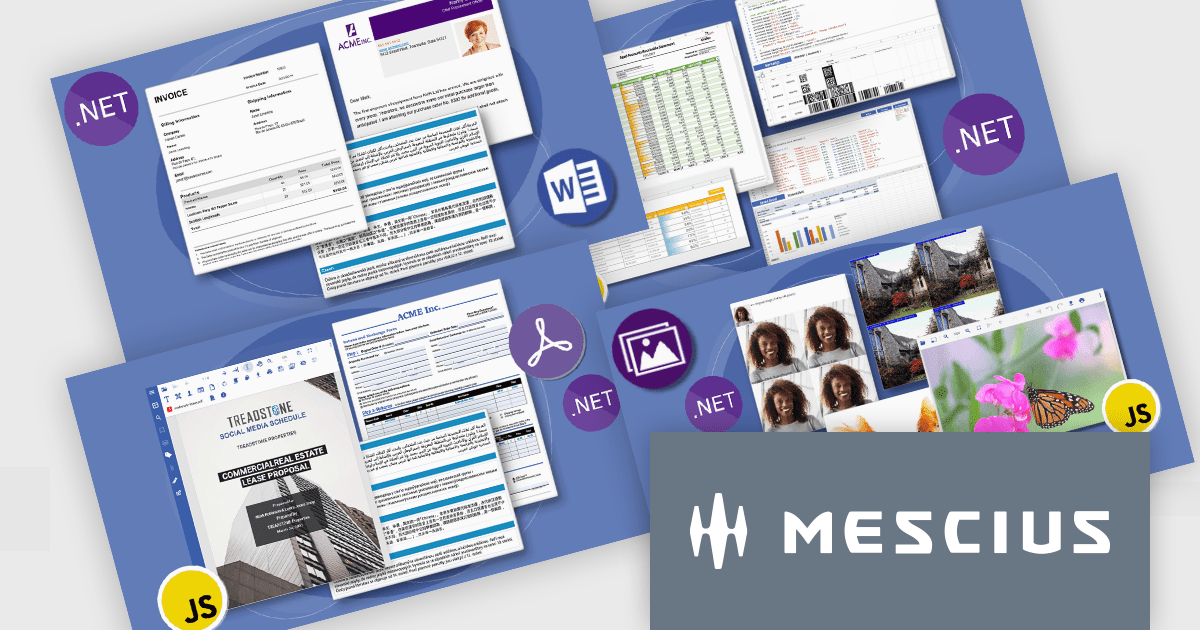
MESCIUS Document Solutions is a comprehensive API library product line that enables developers to work with a variety of documents, including Microsoft Word and Excel, without requiring that you have those applications installed. You can create, load, edit, and save these documents from within your applications with no external dependencies.
Document management is in high demand. Users need to be able to view, edit and exchange a variety of documents in several standard formats. As such, there are many different solutions available to choose from, and making that choice can be a daunting task. In addition to the initial licensing costs, there are other factors that impact the Total Cost of Ownership, such as support costs and annual subscription renewals. Deployment licenses also factor into this, as some products may have different licensing for Internal vs. External distribution.
To assist you in finding the right solution for your needs, MESCIUS has created a Total Cost of Ownership (TCO) comparison that outlines all of the above criteria into a comprehensive, yet concise report. There is even a TCO calculator that will generate a unique comparison for you based on your specific requirements.
Here is just a sample of some of the Advanced Document API Features that are included in Document Solutions:
Document Solutions .NET Bundle includes Excel, Word, PDF, and Imaging solutions, available together for less than the price of two individual products.
View the Document Solutions Total Cost of Ownership comparison to ensure that you have all of the information necessary to make an informed purchase decision for your document management needs.
ActiveReports.NET helps you deliver beautiful reports with intuitive Visual Studio integrated report designers and rich controls. It provides code-based cross-platform reporting, easy-to-use designers, and a flexible API allowing you to design and deliver powerful reports with intuitive, reliable, and user-friendly report designers and controls.
On September 18, 2025 at 11:00 AM EDT, MESCIUS (formerly GrapeCity) will be presenting a CodeClinic Live Webinar to demonstrate how you build advanced reports, showcasing powerful features like dynamic parameters, drill-through navigation, interactive filtering, and much more. If you are a developer looking to elevate your reporting and data visualization capabilities within your .NET applications, then this CodeClinic Live Webinar is just what you need.
Register for the Live Webinar today, and mark your calendar for September 18.
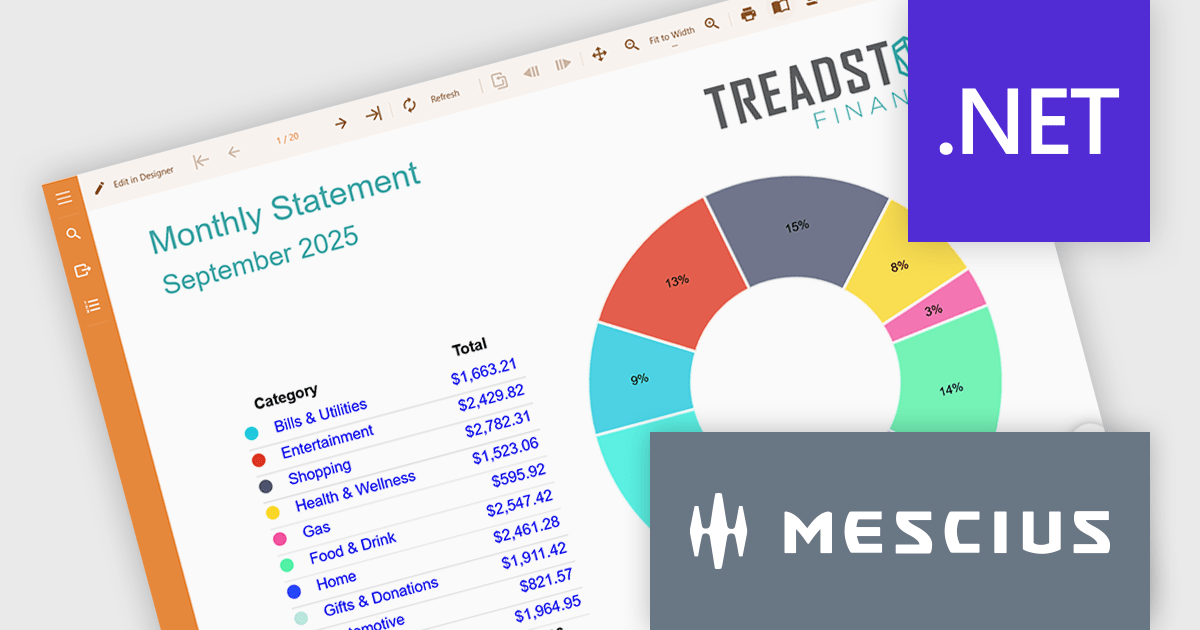
Drill down support in reporting components enables developers to design interactive reports that progressively reveal more detailed data as users click on summary items. This feature allows users to explore underlying datasets directly within the report interface, eliminating the need to switch between views or load separate reports. By structuring data hierarchically, developers can provide a more intuitive and efficient navigation experience for end-users. It is especially valuable in dashboards or business intelligence tools where data granularity is critical for analysis and decision-making.
Several .NET Blazor Reporting controls support drill down features including:
For an in-depth analysis of features and price, visit our comparison of .NET Blazor Reporting Controls.
전화 : 00798 14 800 6332
팩스 : +1 770 250 6199


