


공식 공급 업체
200 이상의 소프트웨어 개발처와 판매 계약을 맺은 공인 디스트리뷰터로서 합법적인 라이선스를 제공합니다.
모든 브랜드 보기.
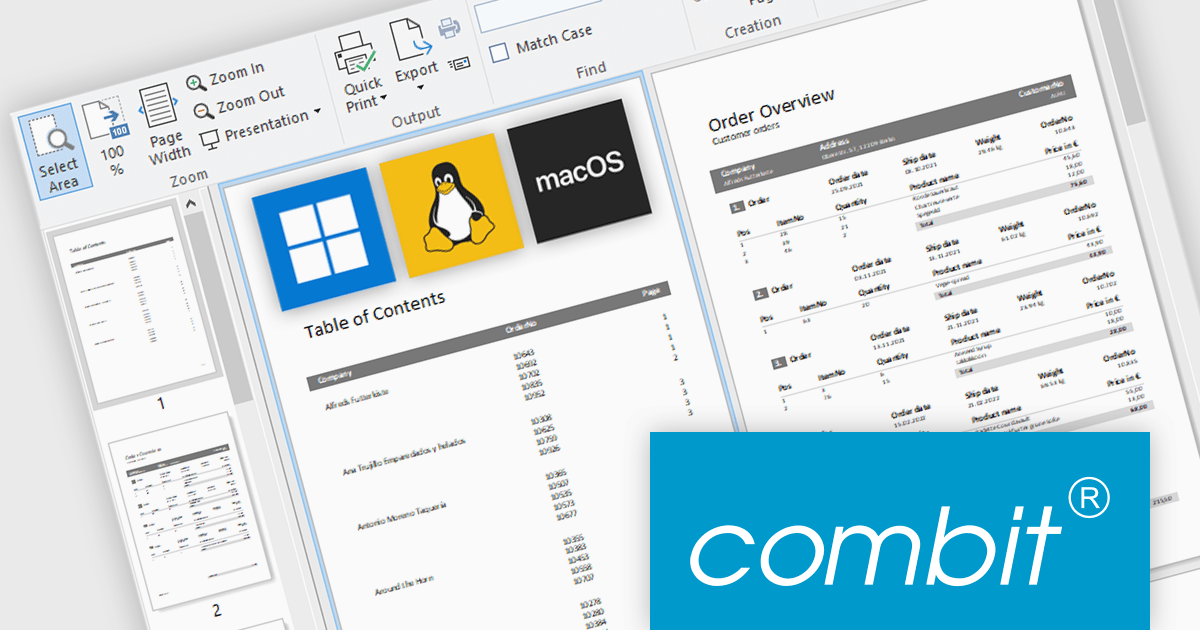
combit have announced an exciting new development for their popular report generator with the introduction of List & Label Cross Platform (LLCP), due for release in October.
This is a significant milestone for combit, as they will now offer a cross-platform reporting solution for Windows, Linux, and macOS. The new powerful print engine is entirely based on the most recent version of .NET, with no native dependencies. For reporting that runs anywhere your app runs.
Features will include:
This cross-platform functionality will only be included as part of the List & Label Enterprise Edition. To help customers benefit from this major advancement, special offers are available until October 9th 2025.
* Subscription terms for free upgrades will not be extended. Special discounted renewal options will be available until October 2026, please contact us for details.
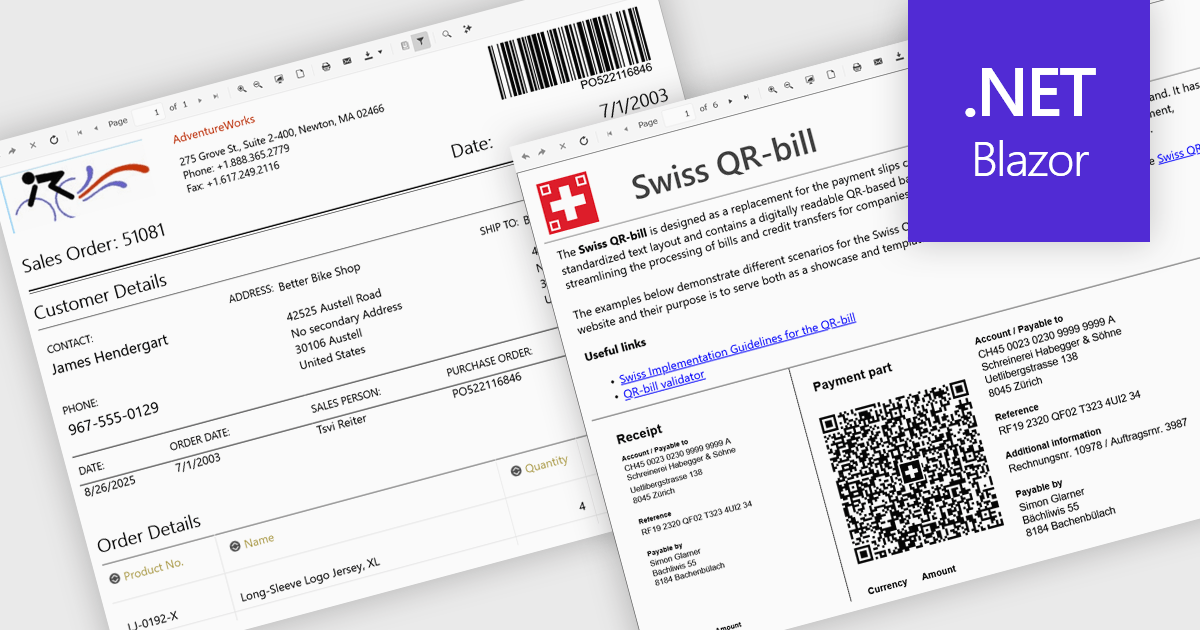
Adding barcodes to reports means embedding machine-readable codes like QR or Code 128 directly into printed or digital outputs. These can be scanned by barcode readers, making data entry faster, reducing errors, and improving traceability. Barcodes also support integration with inventory, logistics, or ERP systems. This feature is especially useful in manufacturing, retail, healthcare, and supply chain environments where accuracy and speed are essential.
Several .NET Blazor Reporting controls include Barcodes including:
For an in-depth analysis of features and price, visit our comparison of .NET Blazor Reporting Controls.
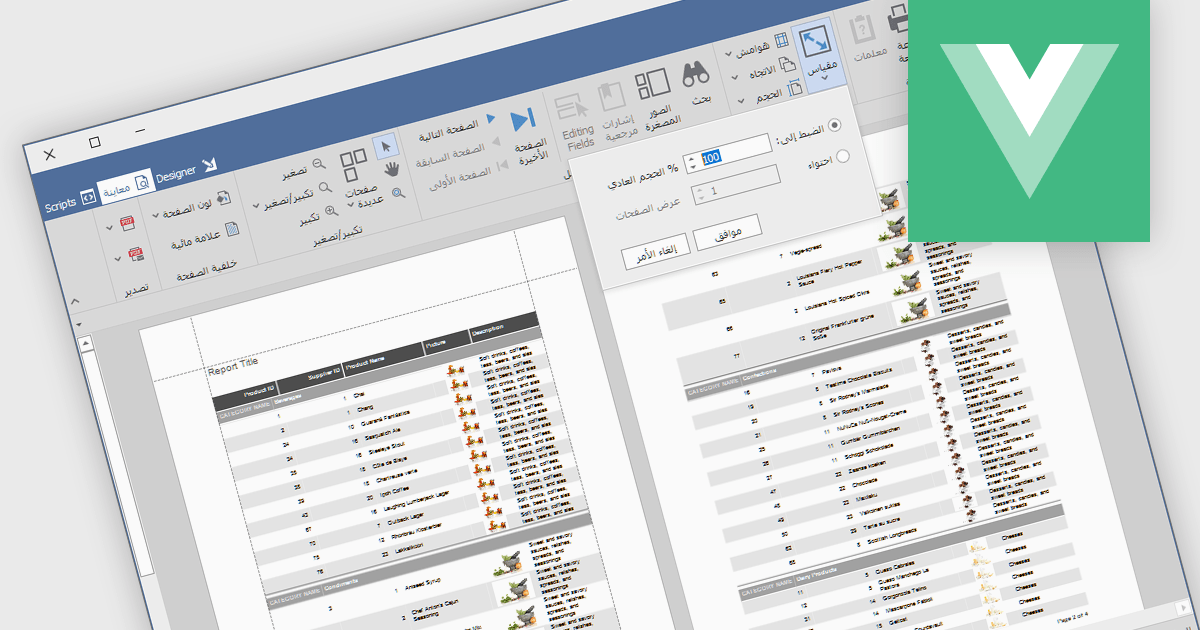
RTL support (Right-to-Left) enables the creation and viewing of reports that can accommodate languages that are read from right to left, such as Arabic, Hebrew, Persian, Urdu, and so on. In the context of report design, this involves aligning text, tables, charts, and interface elements in a way that respects the natural reading direction of said languages, so that the report is displayed correctly for the target audience. Support for RTL languages is a key capability for developers and organizations operating in multilingual environments, ensuring users working in these languages can design, view, and interpret reports accurately and comfortably within the reporting application.
Several Vue.js reporting components include RTL support, including:
For an in-depth analysis of features and price, visit our comparison of Vue.js reporting components.
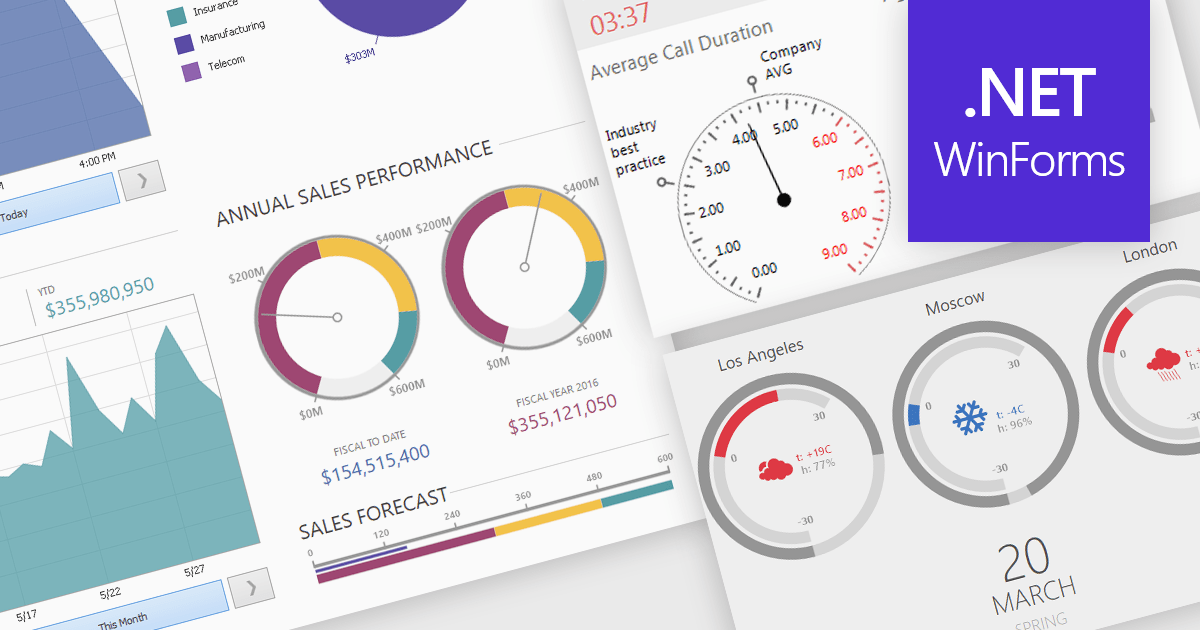
A gauge is a visual reporting element, such as a dial, meter, or progress bar, designed to display a single metric’s value in relation to defined targets or thresholds. For software developers, gauges offer a quick and intuitive way to present key performance indicators, making it immediately clear whether performance is on track, exceeding expectations, or requires attention. By transforming raw data into a simple, at-a-glance visual, gauges reduce the need for users to analyze complex tables or charts, improve the readability of dashboards and reports, and support faster, more informed decision-making.
Several .NET Winforms Reporting controls include Gauges including:
For an in-depth analysis of features and price, visit our comparison of .NET Winforms Reporting Controls.
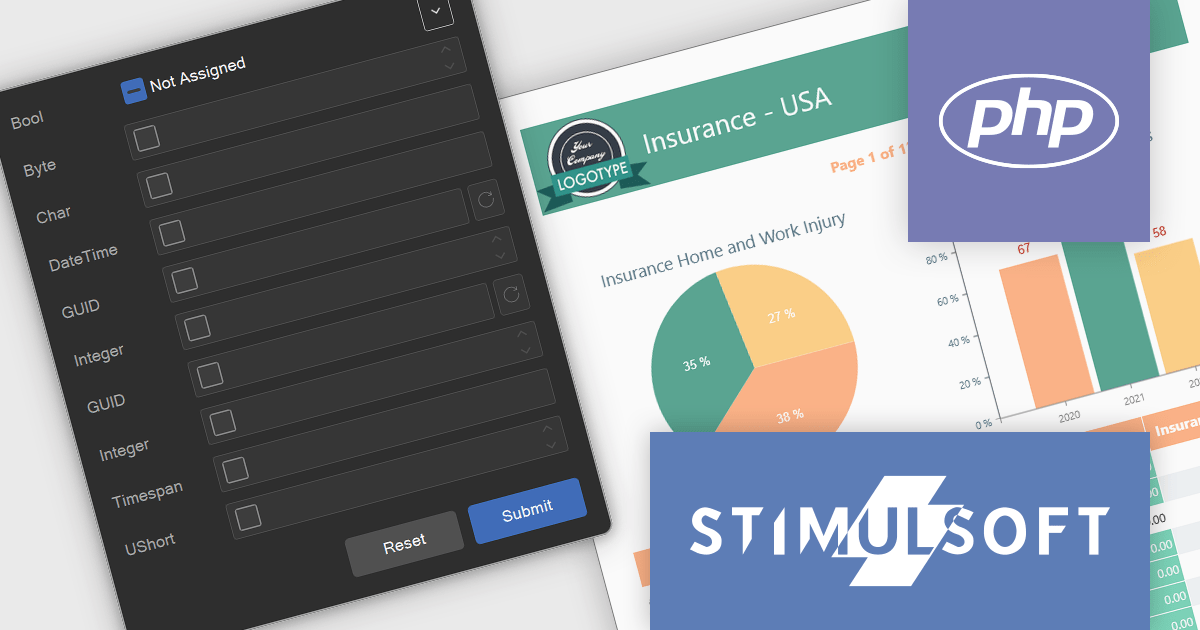
Stimulsoft Reports.PHP is a reporting tool designed to be embedded within PHP applications. It offers a client-server architecture for generating, viewing, printing, and exporting reports online. The solution includes a JavaScript report engine for fast execution, a native JavaScript report designer for building reports with various data sources and visualizations, and a PHP server-side component for data processing. This integration allows developers to seamlessly add robust reporting functionality to their PHP applications.
The latest Stimulsoft Reports.PHP update introduces support for nullable variable states through a new 'Not Assigned' option in the Parameters Panel, allowing developers to define variables without preset values. This enhancement improves alignment with backend data models by accurately representing null or optional inputs, and enables more dynamic report logic by supporting conditional behavior based on whether a variable is assigned. It simplifies parameter management in complex reporting scenarios and enhances user experience by offering greater control over input flexibility.
Stimulsoft Reports.PHP is licensed per developer and is available as a Perpetual license with 1 year support and maintenance. See our Stimulsoft Reports.PHP licensing page for full details.
Stimulsoft Reports.PHP is available in the following products:
전화 : 00798 14 800 6332
팩스 : +1 770 250 6199


