













공식 공급 업체
200 이상의 소프트웨어 개발처와 판매 계약을 맺은 공인 디스트리뷰터로서 합법적인 라이선스를 제공합니다.
모든 브랜드 보기.

ComponentOne WinUI and MAUI Edition is a comprehensive suite of UI components designed for cross-platform .NET development, supporting WinUI, MAUI, UWP, and Xamarin with a single license. It empowers developers to create modern and high-performance applications for business and enterprise use. With versatile controls and seamless integration, the suite simplifies the development process, enhances productivity, and ensures compatibility with the latest .NET platforms, making it an essential tool for delivering exceptional user experiences.
The ComponentOne Studio WinUI & MAUI Edition 2025 v1 update introduces support for FlexViewer and FlexReport in WinUI, enabling developers to seamlessly embed advanced reporting functionality directly into their Windows 11 (WinUI 3.0) applications. With this update, developers can now display FlexReports, SQL Server Reporting Services (SSRS) reports, and PDF documents within a single viewer control, improving document handling and enhancing the end-user experience. FlexReport’s support for .NET Standard further improves cross-platform compatibility, allowing for consistent report generation and rendering across different .NET environments. This release simplifies the development of data-driven desktop applications by providing a reliable and fully integrated reporting solution built specifically for modern Windows UI frameworks.
To see a full list of what's new in 2025 v1, see our release notes.
ComponentOne Studio WinUI and MAUI is licensed per developer on a perpetual basis and includes a 12 month subscription. See our ComponentOne Studio WinUI and MAUI licensing page for full details.
Learn more on our ComponentOne Studio WinUI and MAUI product page.
Telerik Reporting and Telerik Report Server deliver a complete solution for creating, managing, and distributing reports across .NET applications. Telerik Reporting is a lightweight, embedded reporting tool for .NET web and desktop apps. It lets developers and users easily design, customize, and export interactive, reusable reports. It supports multiple platforms, including ASP.NET Core, Blazor, MVC, AJAX, HTML5/JS, Angular, WPF, WinForms, and WinUI. Telerik Report Server is a web-based, server-side solution for centralized report management. Built on Telerik Reporting, it offers scheduling, delivery, user management, and web-based access. It can be used standalone or integrated into apps built with Blazor, Angular, or Windows Forms.
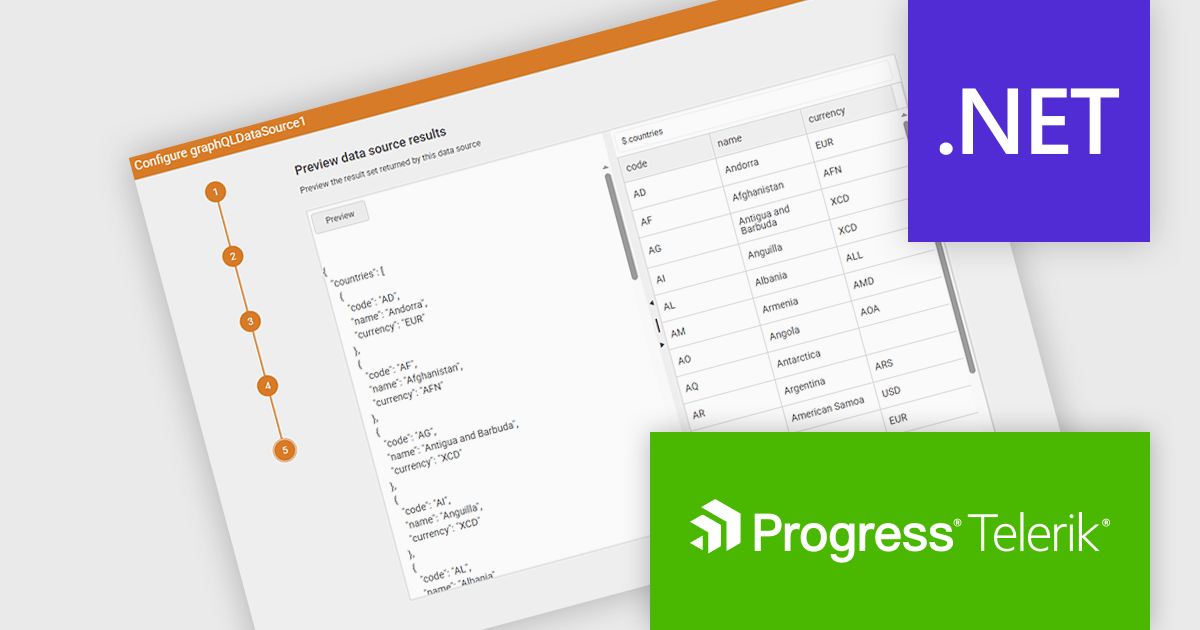
The Telerik Reporting and Telerik Report Server 2025 Q2 update introduces a new GraphQL DataSource Wizard in the Web Report Designer that simplifies the process of connecting to GraphQL APIs. This enhancement improves data integration by guiding developers through a clear, step-by-step configuration process, eliminating the need for manual setup or in-depth knowledge of GraphQL syntax. It enables faster data connectivity and report creation directly within the browser-based design environment, improving overall efficiency and reducing development time when working with GraphQL data sources.
To see a full list of what's new, see our release notes for Telerik Reporting and Telerik Report Server 2025 Q2.
Telerik Reporting is licensed per developer and has two licensing models: an annual Subscription License and a Perpetual License. The Subscription license must be renewed to continue using the software. The Perpetual license is a one-time purchase granting access to the current released version and includes a one-year subscription for product updates and technical support. Telerik Report Server is available as a perpetual license and is licensed per domain. Each domain license contains 15 Client Access Licenses and 1 year support and maintenance. See our licensing pages for Telerik Reporting and Telerik Report Server for full details.
Telerik Reporting and Telerik Report Server are available individually or as part of Telerik DevCraft Ultimate.
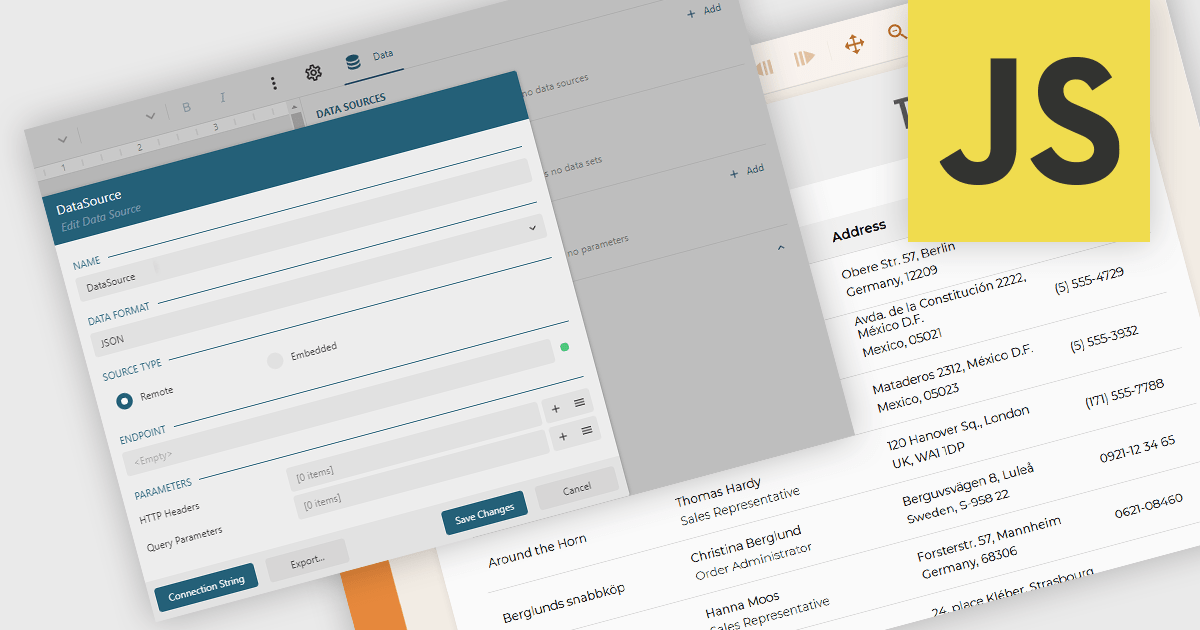
JSON data connectivity in reporting components provides the ability to use JSON (JavaScript Object Notation) data as a primary source for building and generating reports. This feature allows developers and analysts to connect directly to structured JSON data, whether from local files or web APIs, and incorporate it into report designs without the need for complex data transformation or intermediary storage. As JSON has become a widely adopted format for data exchange in modern applications, enabling direct connectivity simplifies the reporting process and ensures that reports can easily reflect up-to-date information from diverse and distributed sources.
Several JavaScript reporting components allow you to use JSON as a data source, including:
For an in-depth analysis of features and price, visit our comparison of JavaScript reporting components.
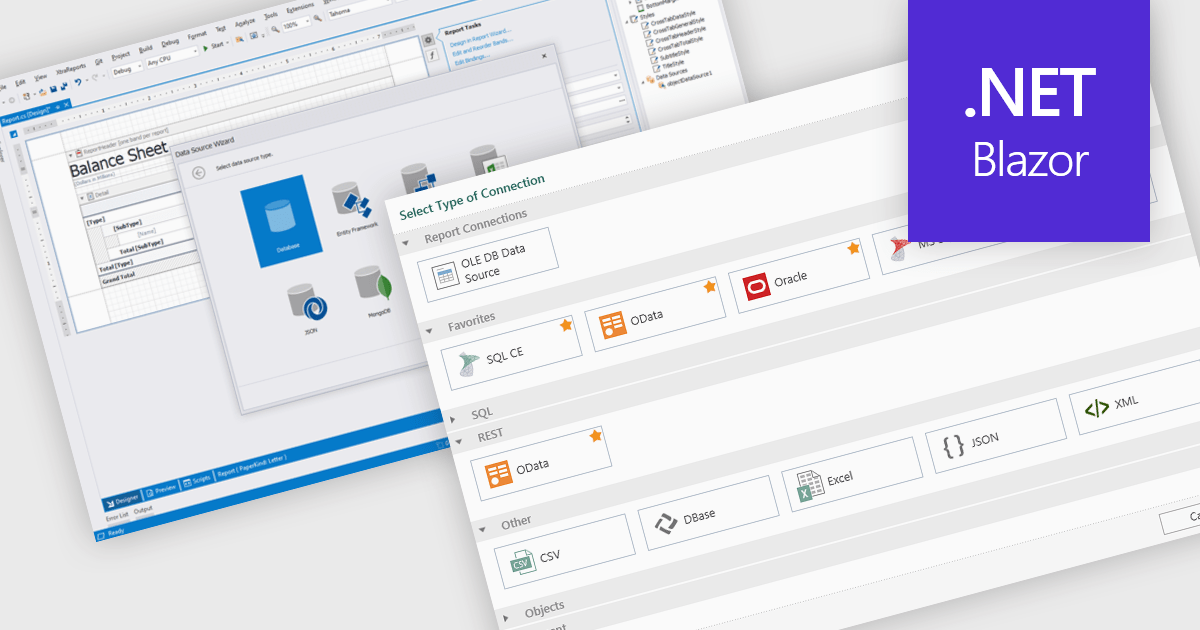
Data connectivity is a foundational aspect of modern reporting components, enabling applications to retrieve and present data from a wide variety of sources. Whether integrating with relational databases, cloud services, or flat files, effective data connectivity ensures that reports reflect current, accurate information. Reporting components are designed to abstract the complexity of accessing these data sources, providing developers with flexible APIs and tools to bind data into visualizations and formatted reports.
Common features include:
For an in-depth analysis of features and price, visit our Blazor reporting components comparison.
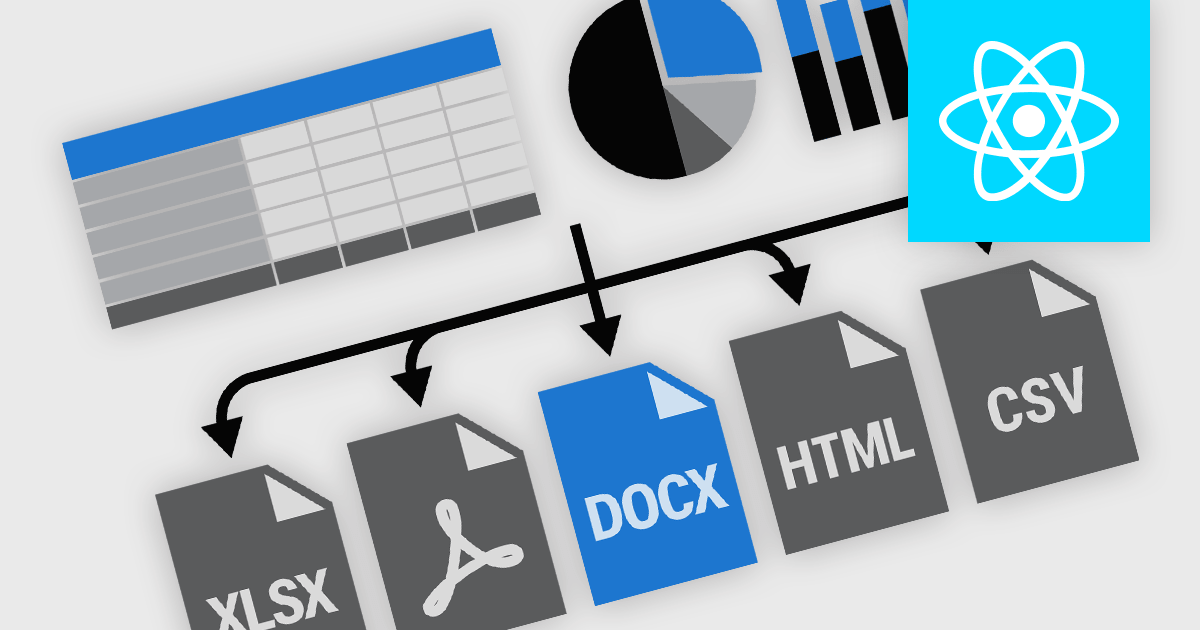
Exporting and printing functionality in reporting components is a core requirement for many software applications, particularly those used in business, finance, and analytics. These capabilities enable users to transform dynamic, on-screen reports into portable or hard-copy formats suitable for distribution, archiving, or further processing. High-performance reporting tools offer flexible export and print options to accommodate various workflows, whether for regulatory compliance, client communications, or internal documentation. Support for a broad range of output formats ensures that users can interact with report content in the way that best suits their needs.
Common features include:
For an in-depth analysis of features and price, visit our React reporting components comparison.
전화 : 00798 14 800 6332
팩스 : +1 770 250 6199


