


공식 공급 업체
200 이상의 소프트웨어 개발처와 판매 계약을 맺은 공인 디스트리뷰터로서 합법적인 라이선스를 제공합니다.
모든 브랜드 보기.
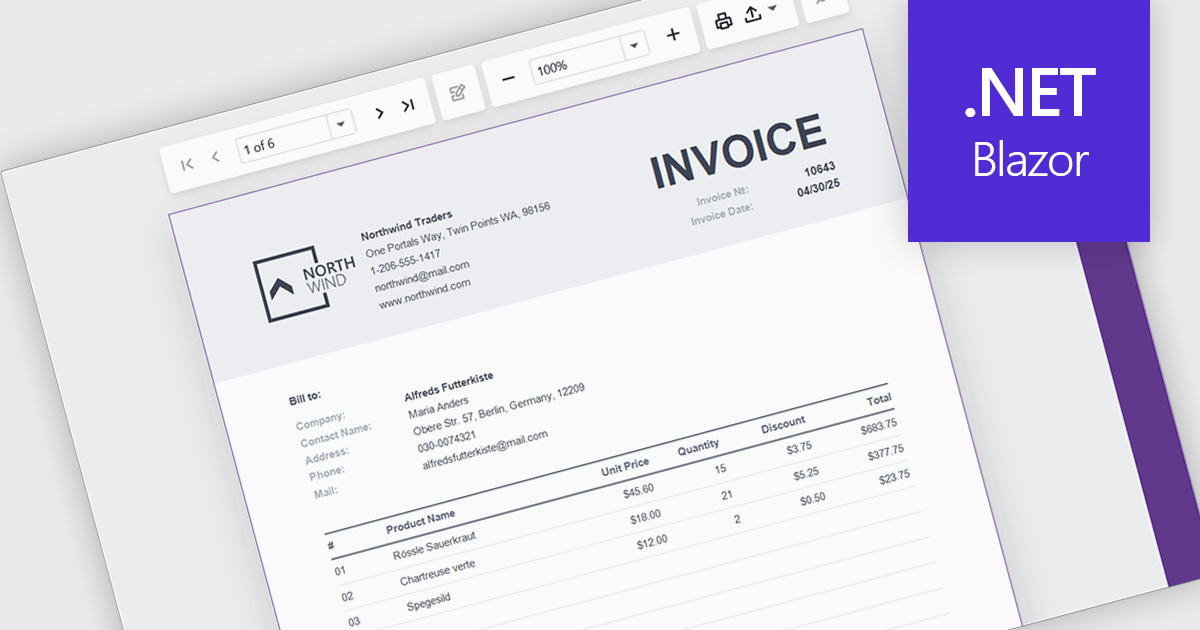
A report viewer is a UI element that renders and displays pre-built reports within a Blazor web application, allowing users to interact with them through features like pagination, parameter input, search, and export. It serves as the front-end interface for consuming reports generated by a reporting engine, often backed by data from databases or APIs. For developers, it enables seamless integration of reporting capabilities into Blazor applications without requiring page reloads or external viewers, supports responsive design for various devices, and maintains a consistent user experience through Blazor's component-based architecture.
Several Blazor Reporting Controls offer support for a report viewer including:
For an in-depth analysis of features and price, visit our comparison of Blazor Reporting Controls.
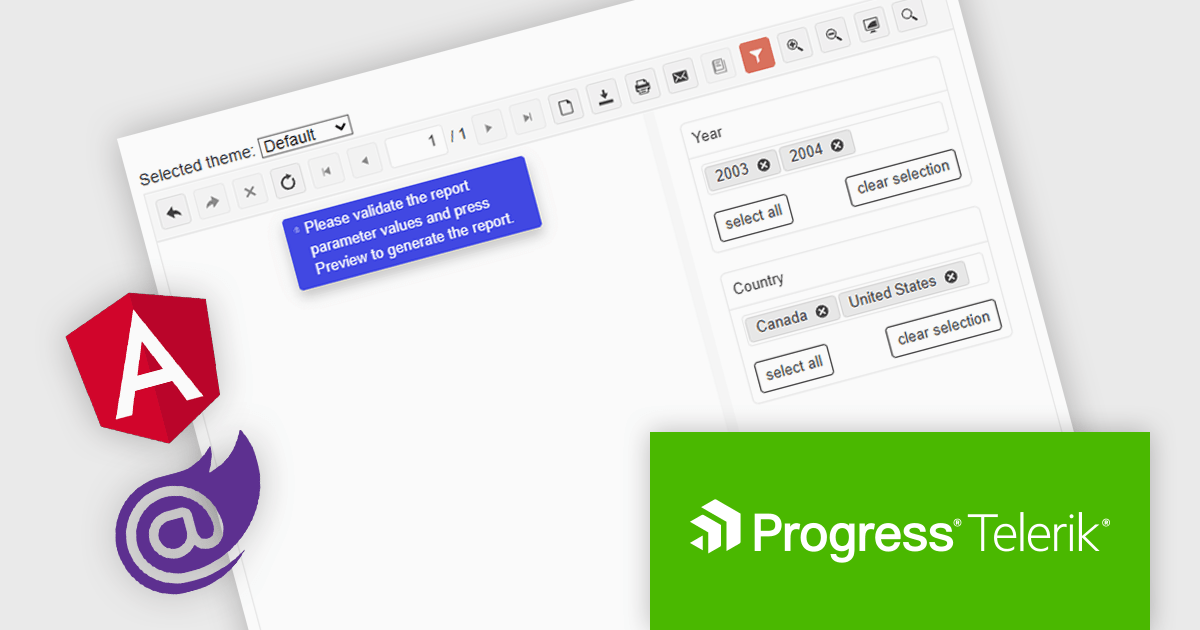
Telerik Reporting is a comprehensive and lightweight embedded reporting tool for .NET web and desktop applications. It enables developers and reporting users to create, design, and export visually appealing, interactive, and reusable reports to effectively present analytical and business data. It supports various technologies, including ASP.NET Core, Blazor, ASP.NET MVC, ASP.NET AJAX, HTML5/JS, Angular, WPF, WinForms, and WinUI.
The Telerik Reporting 2025 Q1 update introduces user-initiated initial report preview in the native Blazor and Angular viewers, giving developers greater control over how and when reports are rendered. Instead of automatically generating reports on viewer load, this feature allows end users to manually trigger the preview process. This improvement helps reduce unnecessary data processing and improves application performance, particularly in scenarios involving large datasets or complex report logic. It also supports more efficient resource management on both the client and server sides, enabling developers to create faster, more responsive, and user-friendly reporting experiences.
To see a full list of what's new in 2025 Q1 (19.0.25.211), see our release notes.
Telerik Reporting is licensed per developer and has two licensing models: an annual Subscription License and a Perpetual License. The Subscription license provides access to the latest product updates, technical support, and exclusive benefits for a flat annual fee, and must be renewed to continue using the software. The Perpetual license is a one-time purchase granting access to the current released version and includes a one-year subscription for product updates and technical support. After this initial period, users can choose to renew the subscription element to continue receiving updates and support; otherwise, they may continue using the installed version available during their active subscription term but will forgo future updates and support. See our Telerik Reporting licensing page for full details.
Telerik Reporting is available to buy in the following products:
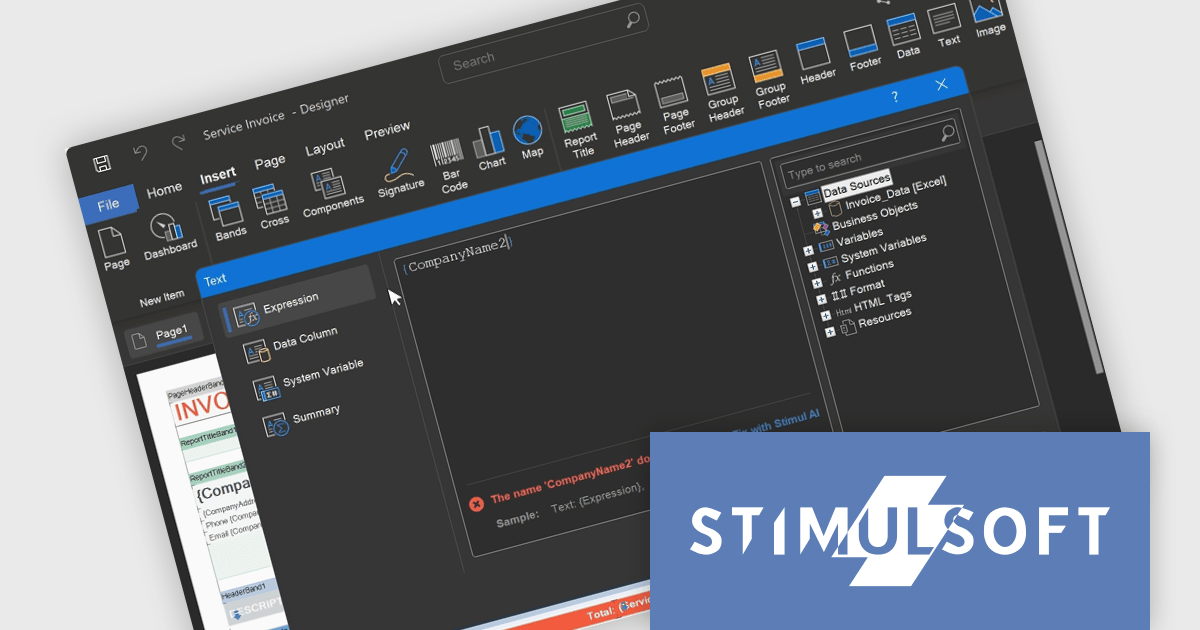
Stimulsoft BI Designer is a powerful reporting tool designed to create visually appealing and interactive reports. It empowers users to design and develop complex reports with ease, integrating data from various sources and presenting it in a clear, concise, and informative manner. With its rich feature set, Stimulsoft BI Designer is widely used in diverse industries, including finance, healthcare, retail, and manufacturing, to generate reports for analysis, decision-making, and compliance purposes. Key benefits include its intuitive interface, extensive customization options, and support for multiple data sources, making it an essential tool for organizations seeking to enhance their reporting capabilities and gain valuable insights.
The Stimulsoft BI Designer 2025.2.1 update introduces an updated expression editor that supports real-time calculation and automatic interpretation. When the report's calculation mode is set to Interpretation, expressions are evaluated instantly as the developer types, with results displayed directly in the editor. This significantly improves the speed and accuracy of report design by reducing context switching and allowing immediate validation of logic. Combined with editor interface improvements and built-in expression samples, the update provides a more efficient and responsive environment for building complex, data-driven reports.
To see a full list of what's new in 2025.2.1, see our release notes.
Stimulsoft BI Designer is available as a perpetual license and is licensed per creator. A creator has an account on the server, has access from the client-side, registered as an editor, and uses the product to work with report templates and dashboards - create, edit, view, delete, etc. See our Stimulsoft BI Designer licensing page for full details.
Stimulsoft BI Designer is available individually or as part of Stimulsoft Ultimate.
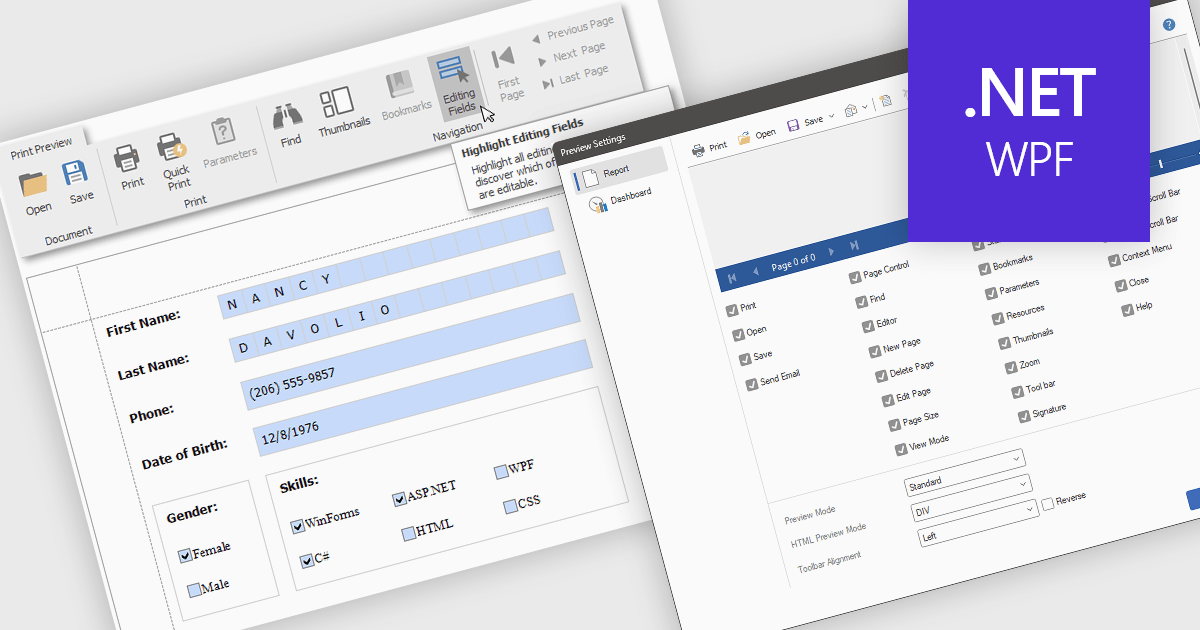
Editing reports in preview mode enables direct modification of report elements like text, charts, and layout within the review window. This approach offers benefits such as faster iteration, improved accuracy, and enhanced efficiency by eliminating the need to switch between edit and preview modes. Teams can adjust chart labels for clarity or tweak a report's layout for better presentation, instantly seeing the impact of their changes and improving the report finalization process.
Several .NET WPF Reporting Controls offer support for editing in preview including:
For an in-depth analysis of features and price, visit our comparison of .NET WPF Reporting Controls.
Data visualization plays a central role in reporting components by translating complex datasets into visual formats that are easier to understand and analyze. These tools help users identify patterns, monitor performance, and communicate key information at a glance. By integrating visuals directly into reports, organizations can enhance readability, support data-driven storytelling, and improve overall user engagement.
Common features include:
For an in-depth analysis of features and price, visit our Angular reporting components comparison.
전화 : 00798 14 800 6332
팩스 : +1 770 250 6199


