













공식 공급 업체
200 이상의 소프트웨어 개발처와 판매 계약을 맺은 공인 디스트리뷰터로서 합법적인 라이선스를 제공합니다.
모든 브랜드 보기.
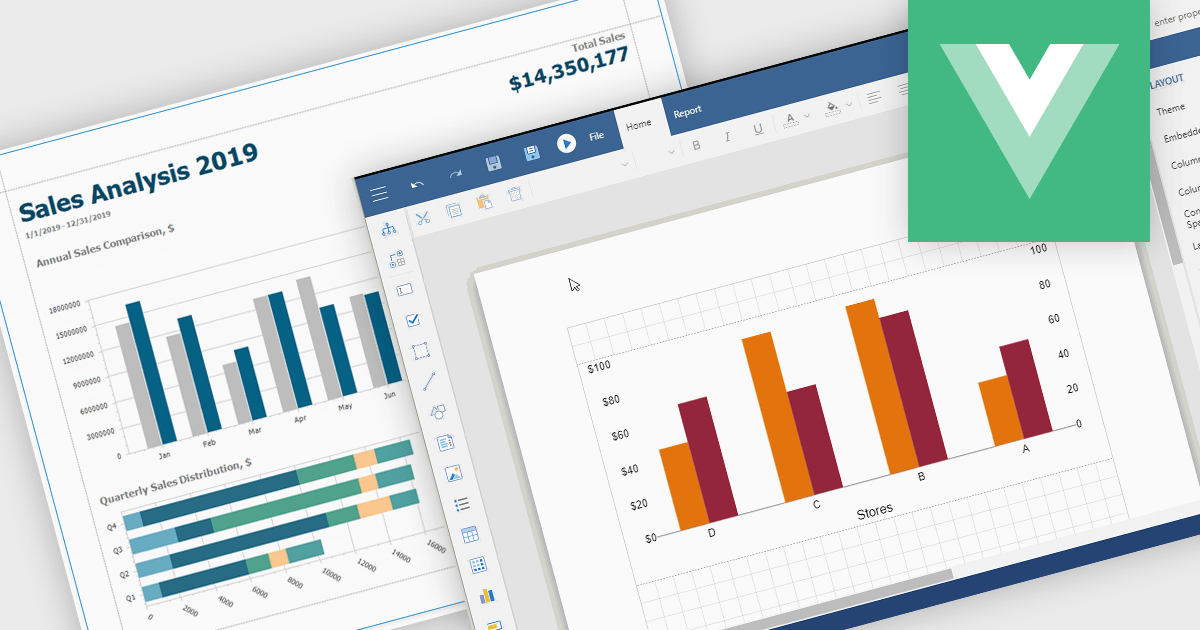
Charts in reports are graphical representations of data such as bar graphs, line charts and pie diagrams that are incorporated into business documents to illustrate key insights and trends at a glance. By converting numbers into intuitive visuals, charts improve clarity and make comparisons between categories or time periods effortless while drawing attention to critical metrics like sales growth, customer churn or budget variances. These visual tools streamline data interpretation, empower stakeholders to make faster more informed decisions, foster alignment across departments and tell a cohesive data driven story without wading through rows of figures.
Several Vue.js reporting components support charts including:
For an in-depth analysis of features and price, visit our Vue.js Reporting Components comparison.
FastReport Online Designer is a cross platform visual report designer for FastReport .NET that enables users to create, edit and view reports on any device running Android, iOS or Windows through a modern web browser on computers, tablets, smartphones, game consoles or TV sets. Common use cases include remote collaboration on operational dashboards, embedding interactive reporting in web applications and empowering business users to customize and share up to date analyses without installing additional software.
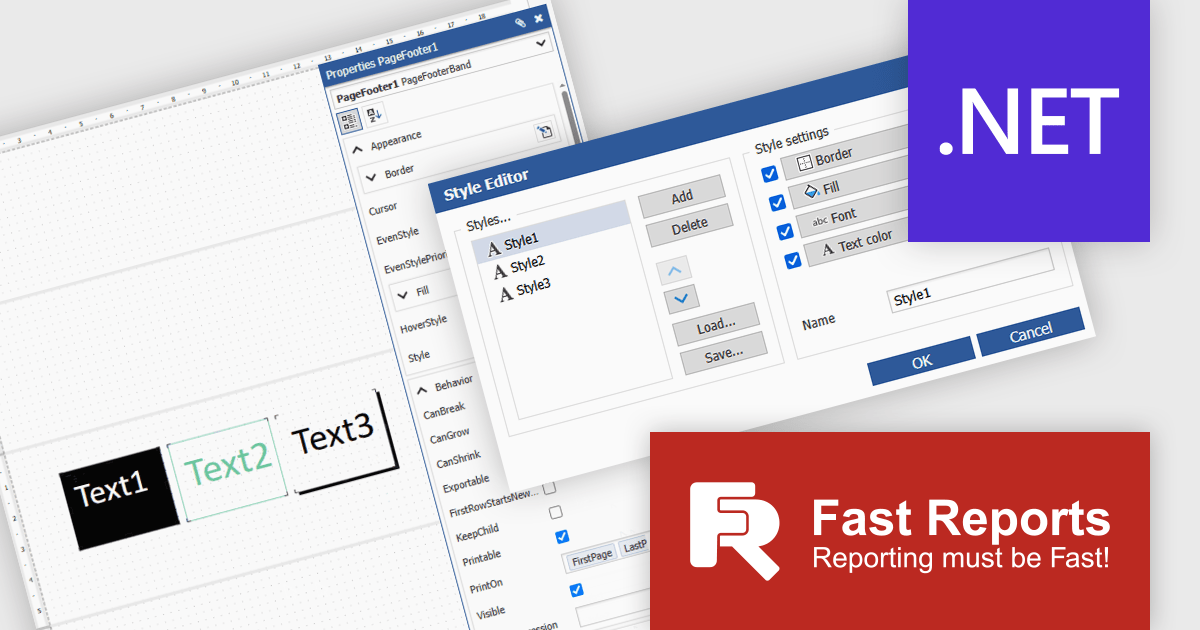
FastReport Online Designer 2025.2 introduces a new style editor that enables users to define and manage report styles in one place. By allowing customization of fill colors, fonts, borders, and more, the feature removes the need for repetitive manual formatting. Users can now create a single style and apply it across multiple components, ensuring visual consistency and reducing formatting time.
To see a full list of what's new in v2025.2, see our release notes.
FastReport Online Designer is available as a license option in the FastReport .NET Components Packages. It is included in FastReport Ultimate .NET and FastReport Web .NET. See our FastReport Online Designer licensing page for full details.
For more information, see our FastReport Online Designer product page.
Stimulsoft Reports.JS provides a robust reporting toolkit designed specifically for JavaScript applications. This library leverages a client-side architecture, offering a pure JavaScript report engine for efficient report rendering directly within web browsers. The solution includes a user-friendly report designer for building reports with various data sources and visualizations, along with a report viewer for seamless integration and display within your JavaScript applications. This eliminates the need for server-side dependencies or browser plugins, simplifying the development process for embedding powerful reporting functionalities into your web projects.
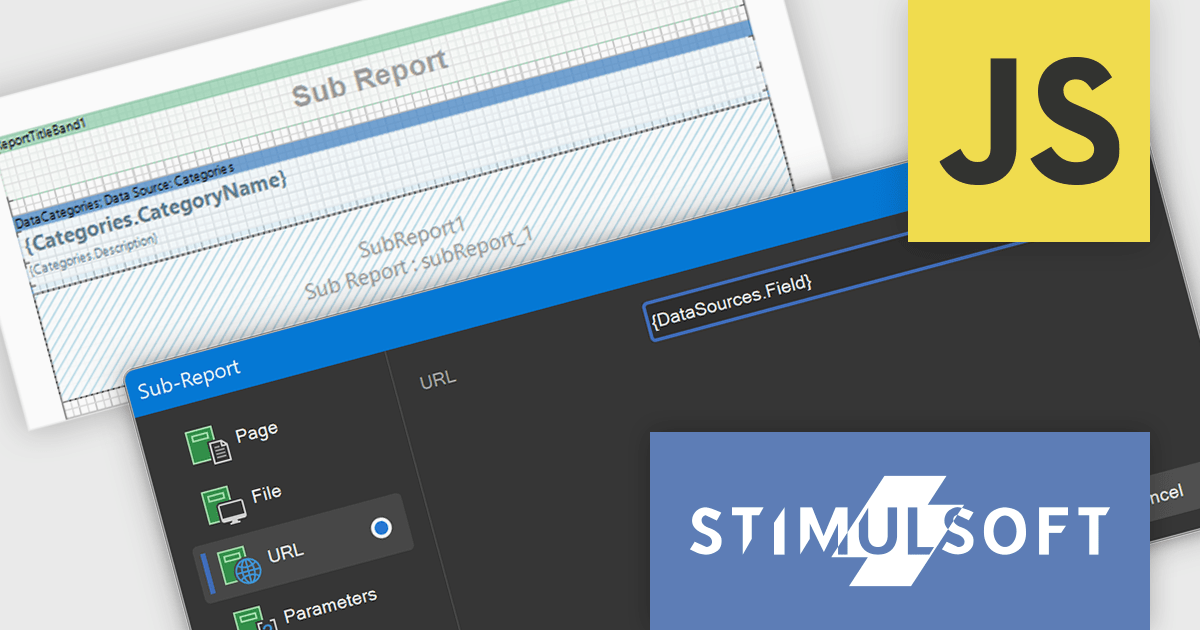
The Stimulsoft Reports.JS includes expressions within the URL and File fields of the Sub-Report component. This functionality helps developers to dynamically determine the source of a sub-report, whether it is a file path or a web address, based on the evaluation of expressions. Consequently, this allows for the creation of more adaptable and context-aware reports where the embedded sub-report content or linked resources are determined programmatically based on the main report's data, offering greater flexibility in report design and data integration without the need for static configurations.
Stimulsoft Reports.JS is licensed per developer and is available as a Perpetual license with 1 year support and maintenance. See our Stimulsoft Reports.JS licensing page for full details.
Stimulsoft Reports.JS is available individually or as part of Stimulsoft Ultimate.
ActiveReports.NET helps you deliver beautiful reports with intuitive Visual Studio integrated report designers and rich controls. It provides code-based cross-platform reporting, easy-to-use designers, and a flexible API, enabling you to design and deliver powerful reports with intuitive, reliable, and user-friendly report designers and controls.
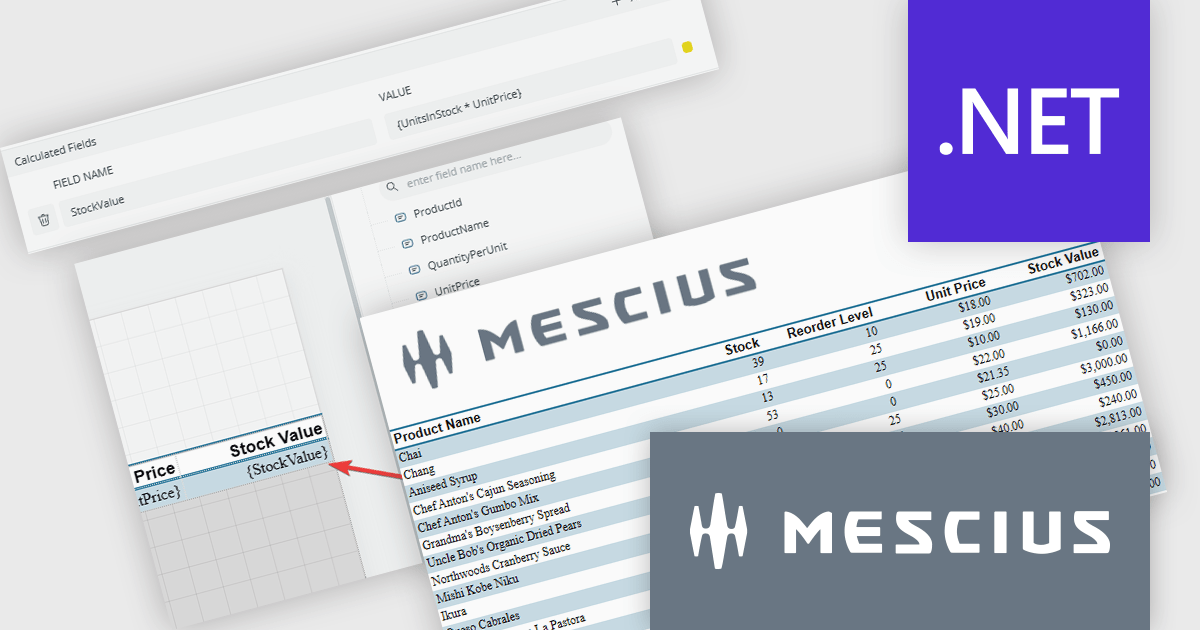
In this blog post, MESCIUS Product Manager Alec Gall shows you how to add a calculated field to your report using the ActiveReports.NET Web Designer. Steps include:
Read the complete blog to learn this simple but powerful method to extend your data inside ActiveReports.NET.
ActiveReports.NET is licensed per developer and is available with or without a 12 month support and maintenance subscription. See our ActiveReports.NET licensing page for full details.
Learn more on our ActiveReports.NET product page.
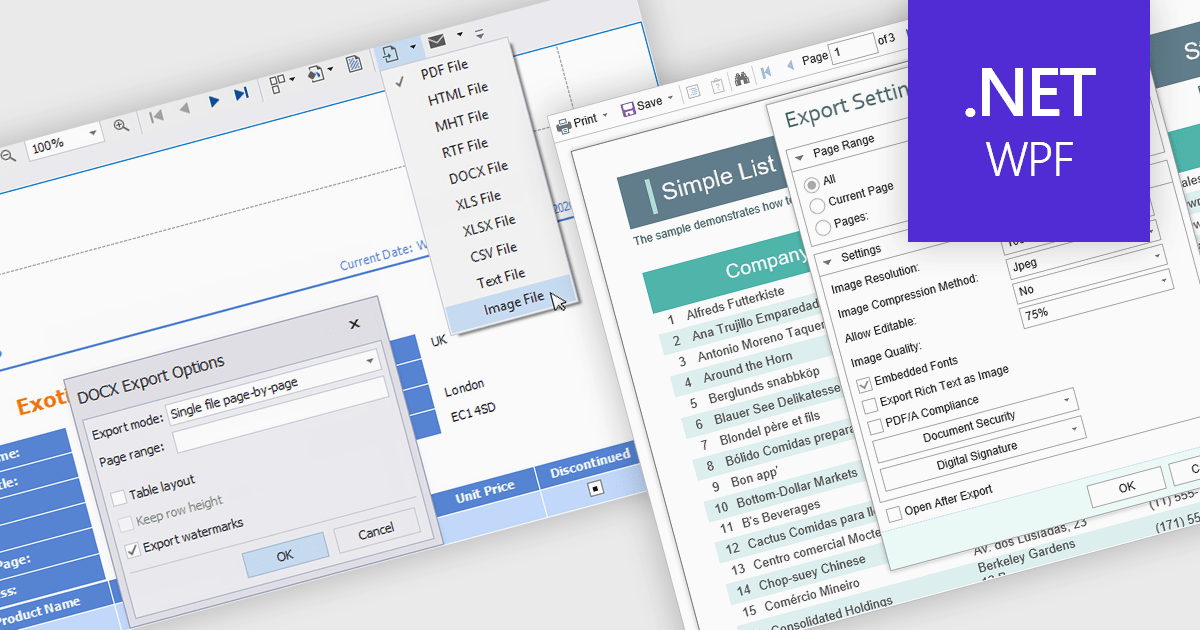
The export to image feature in reporting tools allows users to save a static visual representation of their reports in common image formats such as PNG or JPEG. This functionality offers numerous benefits, including simplified sharing across diverse platforms without requiring specific software, ensuring the consistent presentation of data by preserving formatting and visualizations, and enabling offline access for users who may not have continuous network connectivity. Example use cases include easily embedding key performance indicator dashboards into presentations or emails for broad dissemination, archiving reports for historical record-keeping, and providing accessible versions of data insights for individuals who prefer or require visual formats.
Several .NET WPF reporting controls offer image exporting including:
For an in-depth analysis of features and price, visit our WPF Reporting controls comparison.
전화 : 00798 14 800 6332
팩스 : +1 770 250 6199


