













공식 공급 업체
200 이상의 소프트웨어 개발처와 판매 계약을 맺은 공인 디스트리뷰터로서 합법적인 라이선스를 제공합니다.
모든 브랜드 보기.
Effective data processing and presentation features are an essential part of modern reporting components, enabling users to organize, analyze, and display data in a meaningful way. These capabilities transform raw information into structured, interactive reports that support better decision-making. By allowing users to manipulate data dynamically, apply business rules, and customize the way information is displayed, these features ensure reports remain relevant, insightful, and easy to interpret across different use cases.
Common features include:
For an in-depth analysis of features and price, visit our Vue.js Reporting controls comparison.
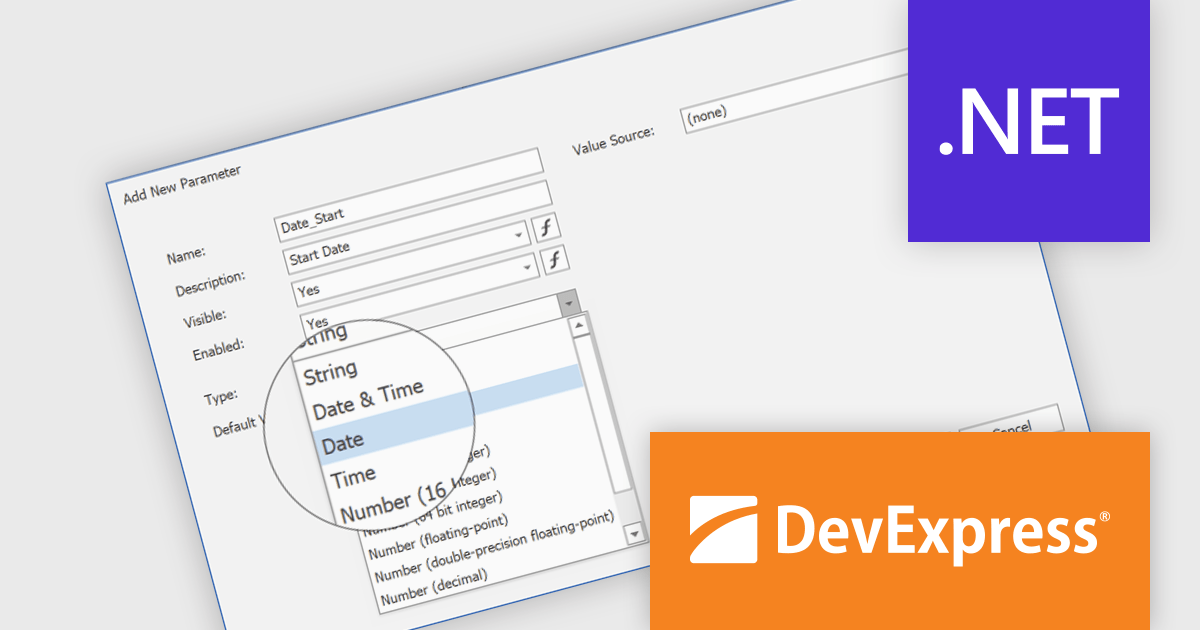
DevExpress Reporting is a comprehensive suite of reporting tools that empowers developers to create visually stunning and highly customizable reports for various applications. With its rich feature set, including data binding, layout design, printing, and exporting capabilities, DevExpress Reporting enables the efficient creation of reports that meet the most demanding business requirements.
The DevExpress Reporting v24.2 update introduces DateOnly and TimeOnly support, enabling more precise data handling in reports. This enhancement allows developers to bind report controls to date or time values without unnecessary datetime components, improving accuracy in calculations, filtering, sorting, and grouping. By eliminating the need for manual conversions, it streamlines query execution and enhances performance when working with date- and time-specific data. With native support for these types, reports can now better align with modern data models, ensuring clarity and consistency across applications.
To see a full list of what's new in version 24.2, see our release notes.
DevExpress Reporting is licensed per developer and is available as a Perpetual License with a 12 month support and maintenance subscription. See our DevExpress Reporting licensing page for full details.
DevExpress Reporting is available to buy in the following products:
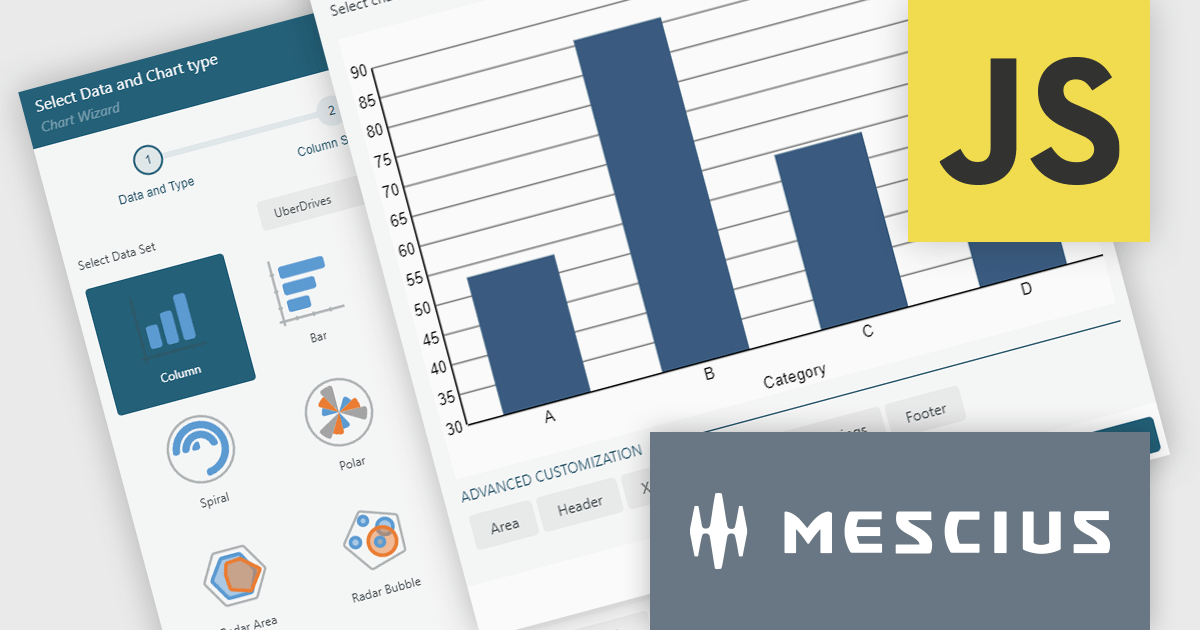
ActiveReportsJS by MESCIUS is a JavaScript reporting toolkit that empowers developers to design and embed interactive reports within web applications. It offers a standalone report designer for crafting reports and a JavaScript report viewer component for seamless integration into web frameworks like React or vanilla JavaScript. This solution streamlines report creation, facilitates data visualization, and delivers a user-friendly report experience.
The ActiveReportsJS 5.2 update introduces a completely revised chart report item, offering greater flexibility and control over data visualization. With enhanced configurability, developers can now customize data binding, axis settings, labels, and legends using dynamic expressions, allowing for more precise and adaptable chart designs. Additionally, seamless migration ensures that existing charts are automatically converted to the new model when older reports are opened in the designer, eliminating the need for manual adjustments. These improvements simplify chart configuration and make it easier to create clear and insightful reports.
To see a full list of what's new in 5.2, see our release notes.
ActiveReportsJS is licensed on an annual subscription or perpetual basis and is available as a Single Deployment License for non-commercial use, and as a Single Domain License or Unlimited Domain License for commercial and/or SaaS use. See our ActiveReportsJS licensing page for full details.
Learn more on our ActiveReportsJS product page.
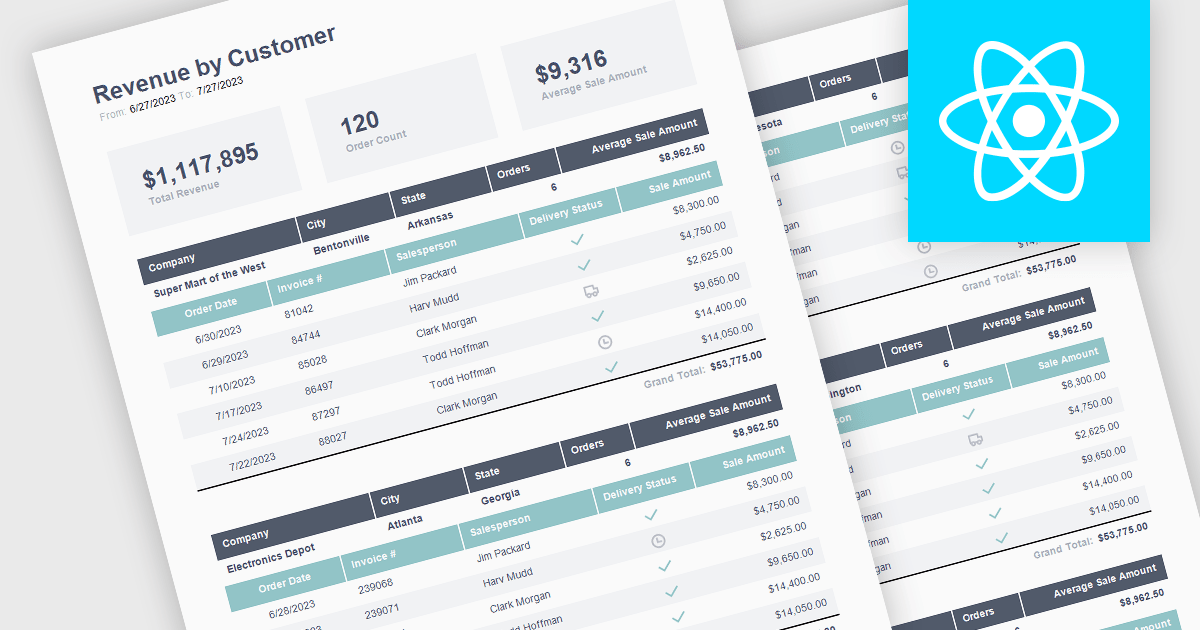
The ability to summarize and aggregate information in a report provides a means of condensing extensive data sets to form part of a concise and meaningful overview of the report's contents. This feature highlights key insights, eliminating the need for readers to sift through raw data. Aggregation processes the data mathematically through calculations such as totals, averages, percentages, means, or medians to identify patterns and trends. By highlighting and summarizing the report's findings in this way, this feature consolidates complex information in a way that aides the reader in identifying patterns and interpreting the data.
The following React reporting components support summaries and aggregates:
For an in-depth analysis of features and price, visit our comparison of React reporting components.
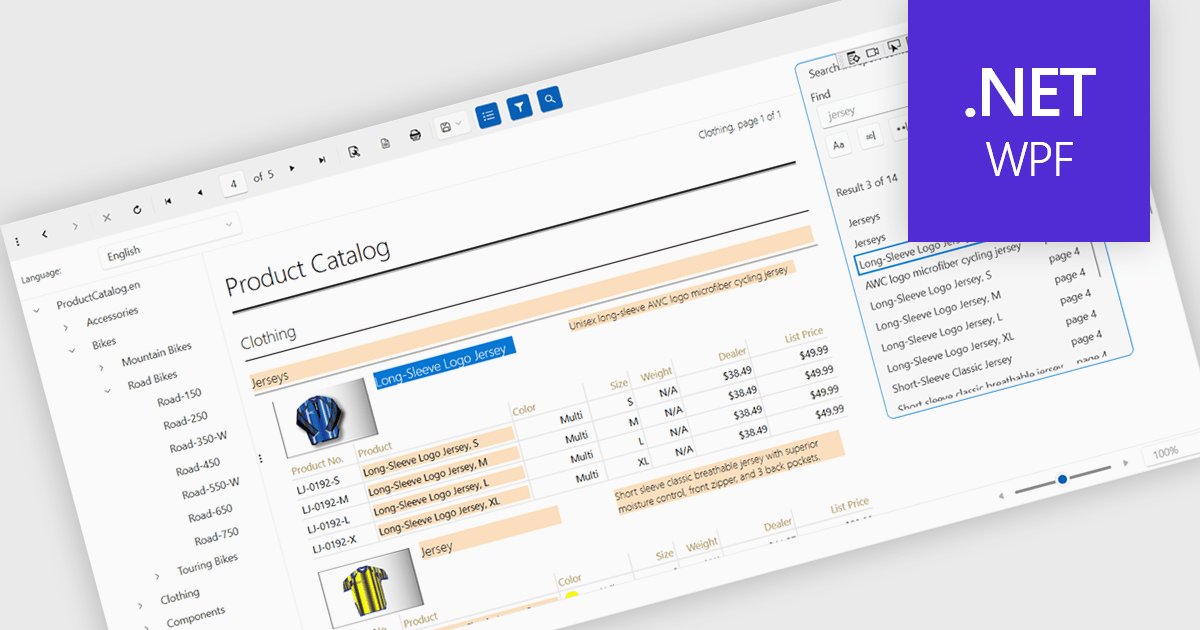
A report viewer is a control that displays rendered reports to the user. It handles the presentation of report data, enabling functionalities like zooming, pagination, searching and exporting to various formats. Essentially, it abstracts the complexity of report rendering and interaction, providing developers with a ready-to-use interface for presenting reports within their applications, thus streamlining development and ensuring a consistent user experience for report consumption.
Several reporting controls feature a WPF report viewer including:
For an in-depth analysis of features and price, visit our WPF Reporting Controls comparison.
전화 : 00798 14 800 6332
팩스 : +1 770 250 6199


