


공식 공급 업체
200 이상의 소프트웨어 개발처와 판매 계약을 맺은 공인 디스트리뷰터로서 합법적인 라이선스를 제공합니다.
모든 브랜드 보기.
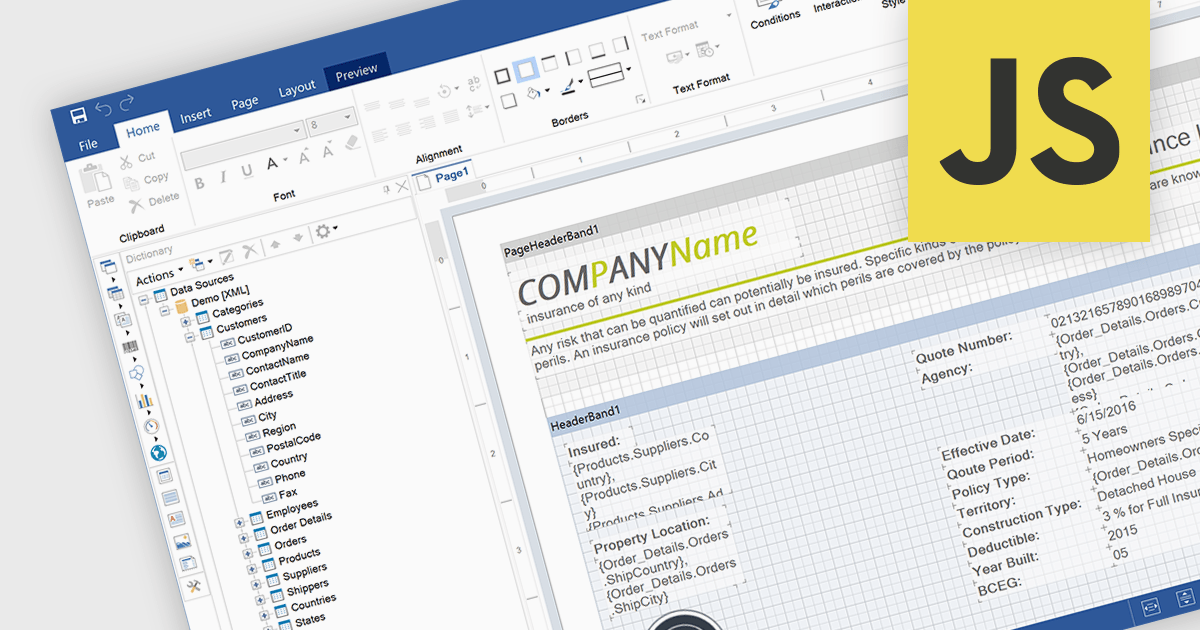
An end user report designer is a browser-based tool that allows non-technical users to create, edit, and customize reports directly within a web application, without needing to write code. It provides an intuitive interface for manipulating data fields, applying filters, formatting content, and configuring layouts, enabling efficient report creation that meets specific business needs. For developers, integrating such a designer reduces the overhead of building and maintaining custom reporting solutions, enhances user autonomy, and improves overall user satisfaction by empowering clients to adapt reports dynamically as their requirements evolve.
Several JavaScript Reporting controls offer an end user report designer including:
For an in-depth analysis of features and price, visit our comparison of JavaScript Reporting Controls.
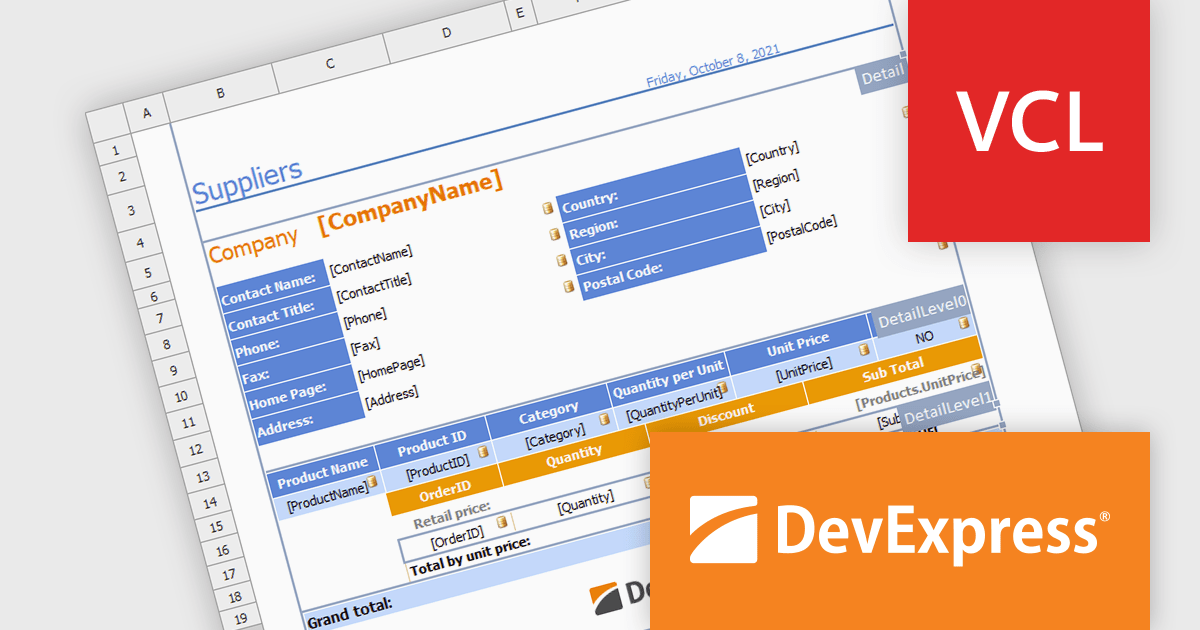
DevExpress VCL Subscription is a comprehensive suite for Delphi and C++ Builder developers that includes high-performance UI components, reporting tools, data visualization elements, and application templates. It lets you build rich, data-driven business applications with ease, offering ongoing updates, technical support, and royalty-free distribution rights, perfect for boosting developer productivity and delivering polished software experiences.
The DevExpress VCL spreadsheet report designer enables users to create dynamic, data-aware reports by binding data from simple datasets or master-detail tables to customizable spreadsheet templates. It automates data population, ensuring accuracy and efficiency in generating professional reports for use cases such as financial summaries, inventory management, and customer analytics. This feature simplifies complex reporting needs while delivering flexibility and precision, making it an essential tool for data-driven applications. The Report Designer is ideal for creating data-driven reports, making it perfect for financial reporting, inventory tracking, sales analytics, and any scenario requiring automated, accurate data presentation within professional templates.
DevExpress VCL Subscription is licensed per developer and is available as a Perpetual License with a 12 month support and maintenance subscription. See our DevExpress VCL Subscription licensing page for full details.
For more information, visit our DevExpress VCL Subscription product page.
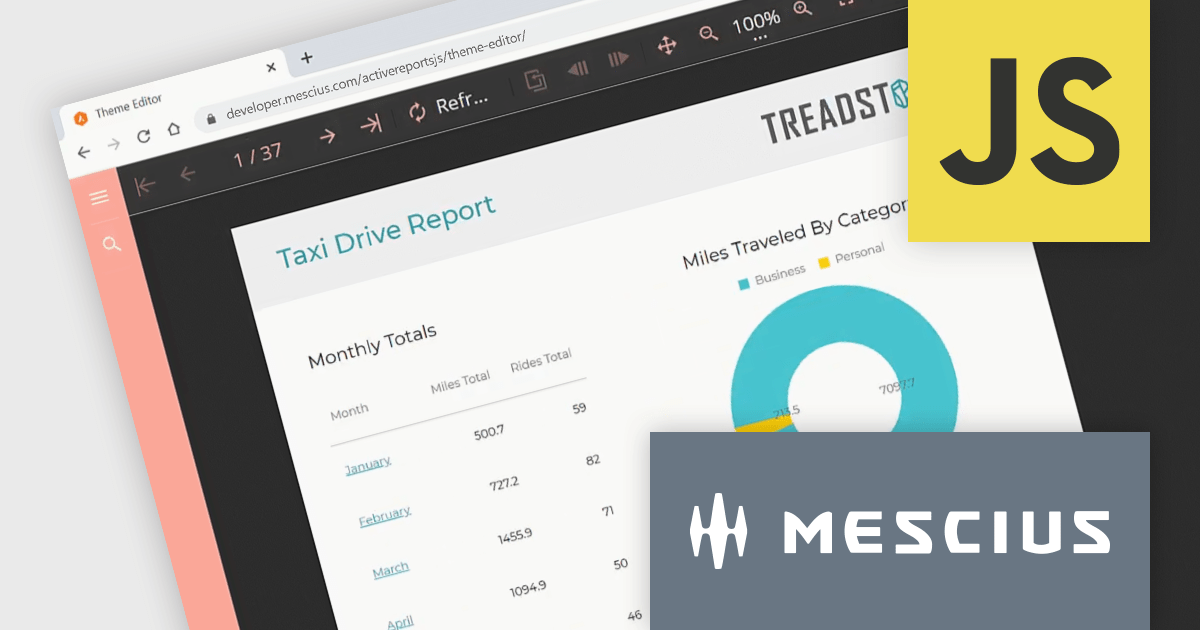
ActiveReportsJS is a robust JavaScript reporting tool that enables developers and report authors to seamlessly design and integrate interactive reports into web applications. It offers advanced features such as drill-down capabilities, runtime data filtering, and interactive parameters, enhancing the functionality and usability of reports. With compatibility across popular frameworks and the flexibility of its report designer component, ActiveReportsJS simplifies the visualization of diverse data sets, making it ideal for applications that require financial reporting, such as balance sheets, and other dynamic reporting needs.
In this blog post, MESCIUS Product Manager Joel Parks shows you how to seamlessly integrate a React Report Viewer into your web application to render, view, and interact with dynamic reports directly within your React project. Steps include:
With the React Report Viewer component, developers can deliver powerful and interactive reporting features that align with the modern requirements of React-based applications, ensuring an optimal user experience.
Read the full blog to learn how to add and customize the Report Viewer component in your React applications.
ActiveReportsJS is licensed on an annual subscription or perpetual basis and is available as a Single Deployment License for non-commercial use, and as a Single Domain License or Unlimited Domain License for commercial and/or SaaS use. See our ActiveReportsJS licensing page for full details.
For more information, visit our ActiveReportsJS product page.

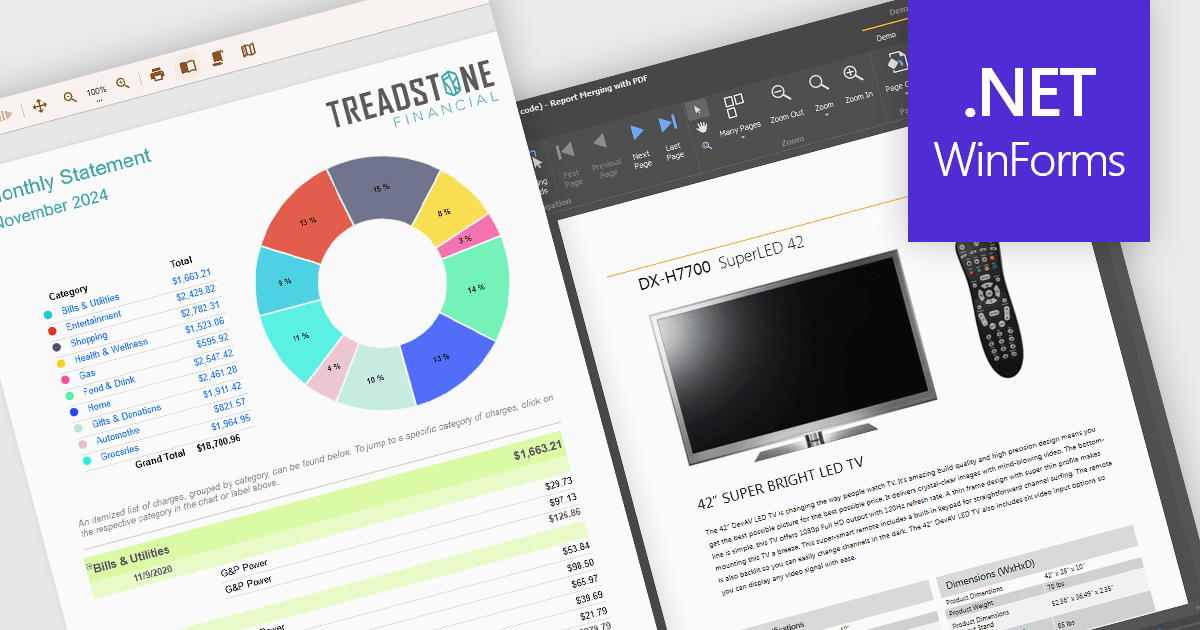
The ability to export reports to XLS/XLSX enables developers to transform report data into Microsoft Excel files in the widely-used XLS or XLSX formats. This allows easy integration of structured data with Excel's powerful data analysis and presentation tools and ensures compatibility with industry standards. It simplifies the dissemination of information by providing end-users with editable spreadsheets that preserve the layout, formatting, and accuracy of the original reports. The capability enhances user experience, streamlines workflows, and supports automated reporting solutions in enterprise and business applications.
Several .NET Reporting Controls offer exporting of reports to XLS/XLSX including:
For an in-depth analysis of features and price, visit our comparison of .NET Reporting Controls.
Text formatting functionality in reporting components lets users customize the appearance of text within reports, including options for fonts, sizes, colors, alignment, spacing, and styles such as bold or italic. Many components also support advanced features like conditional formatting, rich text, and HTML rendering, enabling developers to dynamically style content based on data or incorporate complex visual elements. This functionality is essential for creating professional and polished reports that are easy to read and visually appealing, helping users quickly identify key trends and insights. Use cases range from financial reporting, where precise alignment and emphasis are crucial, to marketing dashboards that require visually engaging presentations to communicate data effectively.
Several WinForms reporting controls offer support for formatted text including:
For an in-depth analysis of features and price, visit our WinForms reporting controls comparison.
전화 : 00798 14 800 6332
팩스 : +1 770 250 6199


