













공식 공급 업체
200 이상의 소프트웨어 개발처와 판매 계약을 맺은 공인 디스트리뷰터로서 합법적인 라이선스를 제공합니다.
모든 브랜드 보기.
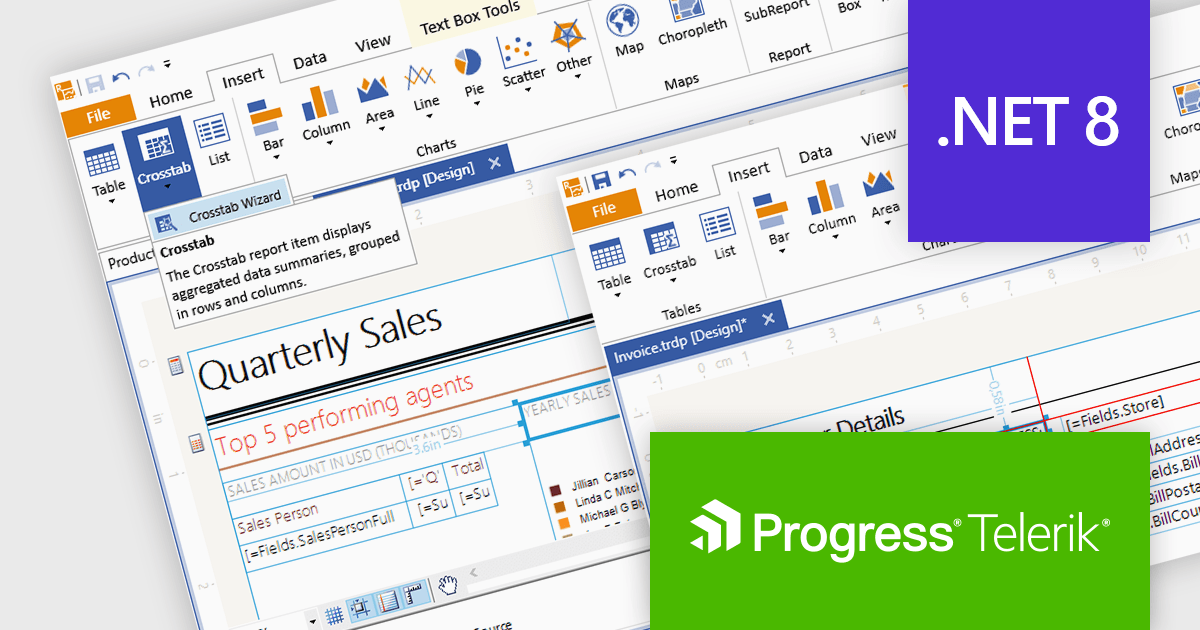
Telerik Reporting is a comprehensive and lightweight embedded reporting tool for .NET web and desktop applications. It enables developers and reporting users to create, design, and export visually appealing, interactive, and reusable reports to effectively present analytical and business data. It supports various technologies, including ASP.NET Core, Blazor, ASP.NET MVC, ASP.NET AJAX, HTML5/JS, Angular, WPF, WinForms, and WinUI.
The Telerik Reporting 2024 Q1 release updates the standalone report designer's target framework from .NET 6 to .NET 8. The designer is a desktop based WYSIWYG reporting tool for Windows, powered by Telerik's reporting engine, that enables users to generate, modify, preview, export and share reports with ease, which can now be achieved using the latest version of Microsoft's popular framework.
To see a full list of what's new in 2024 Q1, see our release notes.
Telerik Reporting is licensed per developer and is available as a perpetual license with a one year support subscription, which is offered in three tiers: Lite, Priority or Ultimate. See our Telerik Reporting licensing page for full details.
Telerik Reporting is available to buy in the following products:

Report drill down functionality allows users to explore deeper into summary data and discover detailed information. For a report showing sales by product category, visitors could click on a category to view a breakdown of individual products, and then drill down even further, by brand or model. This interactive capability promotes a greater understanding and discovery of trends within the report. The intuitive data navigation allows users to peel back layers of data to uncover trends, anomalies, and patterns that may not be obvious in summarized representations. Drilling down into data helps consumers make better decisions by giving them the precise insights they need to back up their conclusions.
Several .NET 8 WinForms Reporting components support drill down functionality, including:
For an in-depth analysis of features and price, visit our .NET 8 WinForms Reporting Controls comparison.

Mail merge in reporting software is a feature that allows users to automatically generate letters, labels, and other documents by merging a template with data. This is typically used to create personalized documents in bulk, such as invoices, form letters, or address labels, saving time and reducing errors compared to manually entering information. Mail merge is widely used in marketing, customer service, and administrative tasks, making it a valuable asset for any organization sending bulk communications.
Several WPF Reporting controls provide Mail Merge functionality including:
For an in-depth analysis of features and price, visit our WPF Reporting Controls comparison.

ActiveReportsJS is a reporting tool for web applications that allows developers and report authors to easily design and display reports within their applications. With a wide range of features, such as drill-down, runtime data filtering, and parameter-driven reports, as well as compatibility with popular frameworks, ActiveReportsJS simplifies the process of creating and managing reports.
A Tablix is a versatile report item that acts as a unified platform for displaying data in table, matrix (cross-tab), and list formats. It offers a flexible layout grid with nested rows and columns, allowing you to structure data for easy analysis and visualization. This empowers you to present detailed information, group data by categories, and summarize key metrics, all within a single report element.
In this blog, MESCIUS Technical Engagement Engineer Joel Parks shows you how to use ActiveReportsJS to add a Tablix control to your JavaScript report. Steps include:
Read the full blog and give your users the ability to create flexible reports with the ability to adapt to changing data conditions.
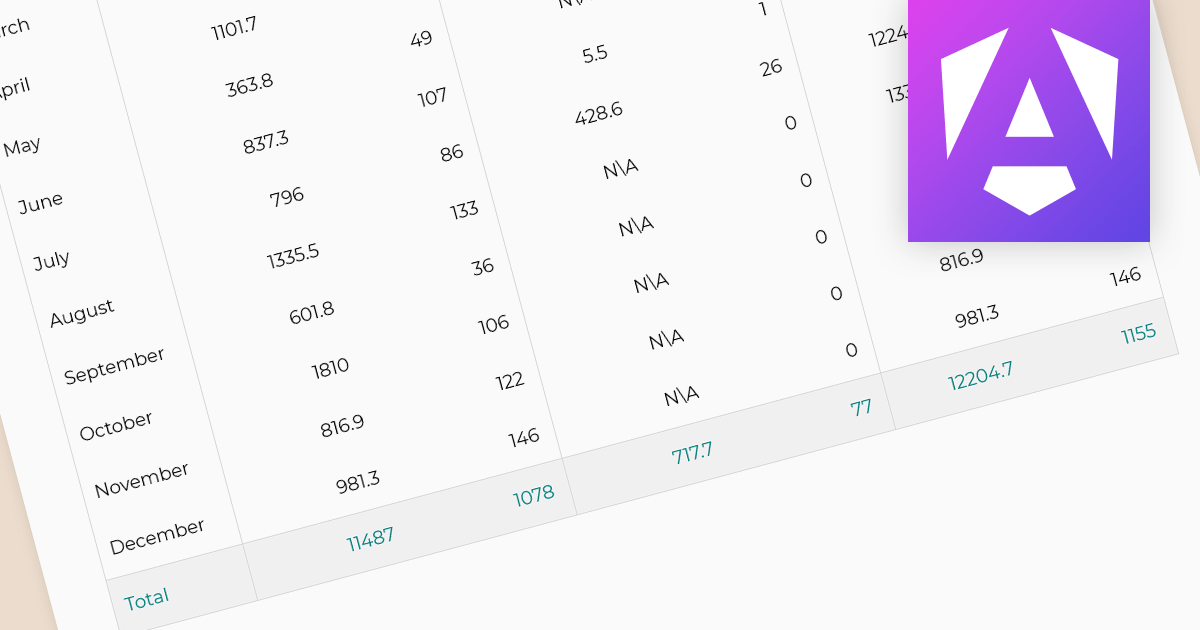
In reporting tools, summaries and aggregates are powerful tools for condensing and presenting large datasets into meaningful insights. Summaries condense data by highlighting key points, such as averages, counts, or maxima/minima, often using text or visuals. Aggregates mathematically combine data points, like calculating sums, means, or medians, typically displayed in tables or charts. Both approaches help users quickly grasp the essence of the data, identify trends, and make informed decisions. Summaries act as concise narratives and aggregates as numerical snapshots, working together to paint a clear picture from complex information.
The following Angular reporting components support summaries and aggregates:
For an in-depth analysis of features and price, visit our Angular Reporting Components comparison.
전화 : 00798 14 800 6332
팩스 : +1 770 250 6199


