













공식 공급 업체
200 이상의 소프트웨어 개발처와 판매 계약을 맺은 공인 디스트리뷰터로서 합법적인 라이선스를 제공합니다.
모든 브랜드 보기.

FastReport VCL is a reporting tool for developers using Delphi, C++Builder, and RAD Studio. It simplifies creating reports like invoices, labels, and data visualizations within your applications. FastReport offers a visual designer for easy report creation, supports various data sources, and allows for data encryption to ensure security. This lets developers easily integrate powerful reporting functionality into their software without needing to build it from scratch.
The FastReport VCL 2024.2 update expands its geographic data visualization capabilities with support for GeoJSON and TopoJSON formats. This allows you to incorporate maps and geospatial data directly into your reports, enhancing your ability to communicate geographic trends, distributions, and patterns with greater clarity and precision.
To see a full list of what's new in 2024.2, see our release notes.
FastReport VCL is licensed per named user and is available as a Perpetual license with 1 year of technical support and product updates. See our FastReport VCL licensing page for full details.
For more information, see our FastReport VCL product page.

Charting support within a reporting component refers to the functionality that enables data visualization through charts and graphs. This integration offers several advantages for developers. By leveraging built-in charting capabilities, developers can streamline the reporting process, reducing the need for manual chart creation and improving report clarity and interactivity for end users. This not only saves development time but also fosters a more intuitive user experience for data exploration and analysis.
Several Vue.js reporting components support charts including:
For an in-depth analysis of features and price, visit our Vue.js Reporting Components comparison.
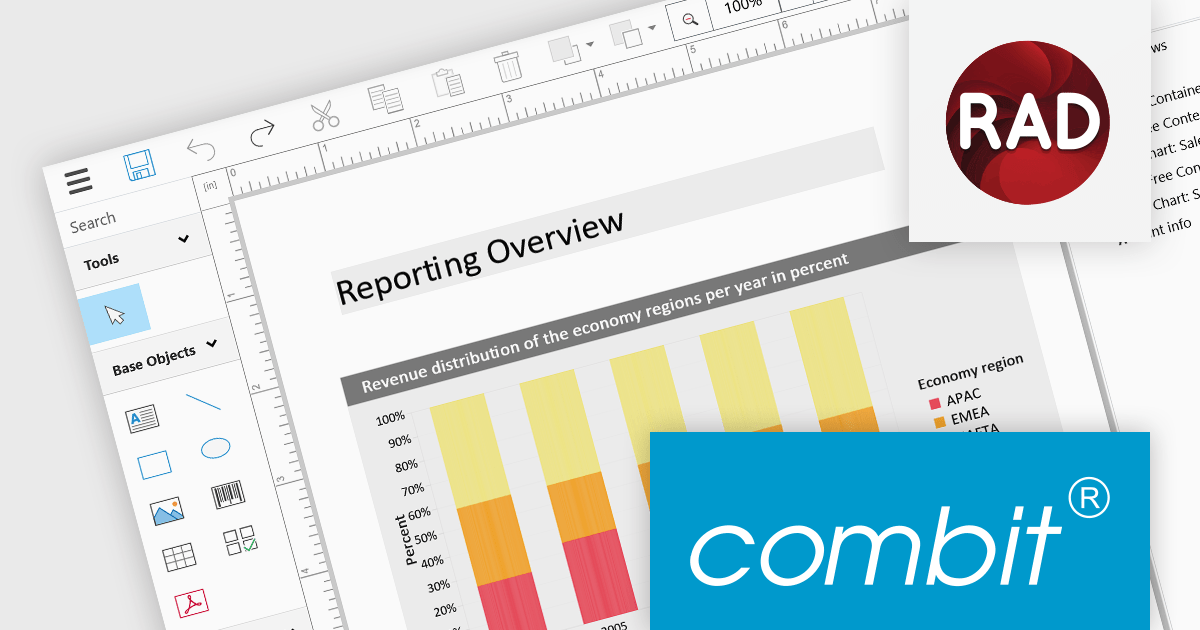
List & Label by combit is a software development toolkit that empowers software developers to integrate comprehensive reporting functionalities into their desktop, web, and cloud applications. It offers features such as data binding, complex data visualization, and a user-friendly report designer, along with printing, exporting, and previewing capabilities. List & Label operates independently of programming languages and data sources, providing developers with the flexibility to design and deliver informative reports within their development environment.
The List & Label 29.002 service pack adds support for Embarcadero RAD Studio 12.1. This compatibility allows developers to utilize List & Label’s VCL components with the new version of RAD Studio to seamlessly integrate its reporting functionalities into their RAD Studio projects. This support enhances the development experience for users creating Windows reporting applications using the RAD Studio IDE.
To see a full list of what's new in 29.002, see our release notes.
List & Label is licensed per developer and is available as a Perpetual License with a 12 month support and maintenance subscription. See our List & Label licensing page for full details.
List & Label is available in the following products:
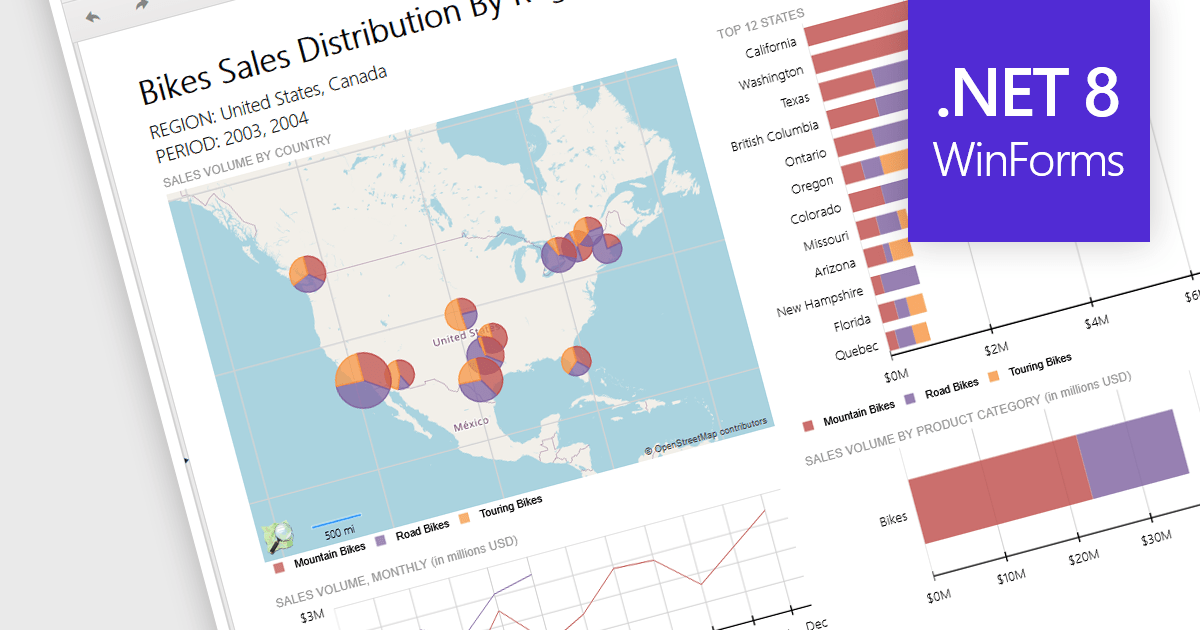
Reporting controls with map support empower developers to create insightful reports by visualizing location-based data. This functionality allows overlaying diverse datasets directly onto geographic layouts, facilitating spatial analysis and revealing patterns that might be hidden in traditional tables or charts. By integrating maps, reports become more interactive, engaging users and enabling location-specific data exploration. This ultimately enhances decision-making by providing clear and immediate visual insights into the geographical distribution of data. Maps offer a more intuitive way to communicate complex datasets, particularly valuable for demographics, regional sales, resource allocation, or any scenario where geographical context is crucial.
Several .NET 8 WinForms reporting controls offer maps, including:
For an in-depth analysis of features and price, visit our comparison of .NET 8 WinForms reporting controls.
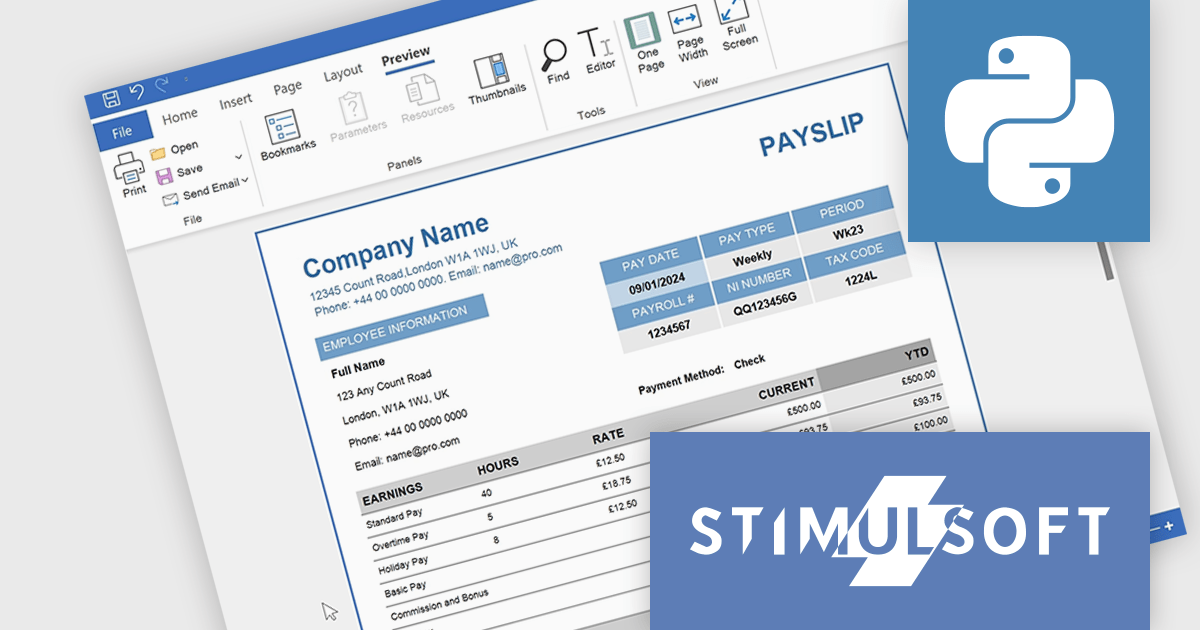
Stimulsoft Reports.PYTHON offers a robust reporting solution for Python developers. It integrates seamlessly into various development environments and boasts cross-platform compatibility. This empowers you to design visually stunning reports featuring charts, gauges, and other interactive elements. By leveraging Stimulsoft Reports, you can efficiently generate informative summaries of your Python application's data, enhancing decision-making capabilities.
Stimulsoft Reports.PYTHON offers a number of benefits for developers. Its versatile data source connectivity allows for effortless report generation from various sources. Additionally, the client-server architecture ensures efficient report processing and a smooth user experience. This makes Stimulsoft Reports.PYTHON an ideal solution for creating informative reports across diverse use cases, from generating financial statements and sales invoices to compiling customer data and project summaries.
Stimulsoft Reports.PYTHON is licensed per developer and is available as a Perpetual license with 1 year support and maintenance. See our Stimulsoft Reports.PYTHON licensing page for full details.
Stimulsoft Reports.PYTHON is available in the following products:
전화 : 00798 14 800 6332
팩스 : +1 770 250 6199


