


공식 공급 업체
200 이상의 소프트웨어 개발처와 판매 계약을 맺은 공인 디스트리뷰터로서 합법적인 라이선스를 제공합니다.
모든 브랜드 보기.

.NET reporting controls address the challenge of integrating existing reports into new .NET applications. These controls offer conversion tools that can import reports from popular third-party vendors, allowing you to seamlessly migrate your reporting functionality without starting from scratch. This not only saves development time but also ensures continuity for users familiar with the previous report format. These controls are ideal for scenarios where legacy applications are being modernized or when integrating reports from acquired systems.
Several .NET reporting controls offer third party report conversion, including:
For an in-depth analysis of features and price, visit our comparison of .NET reporting controls.
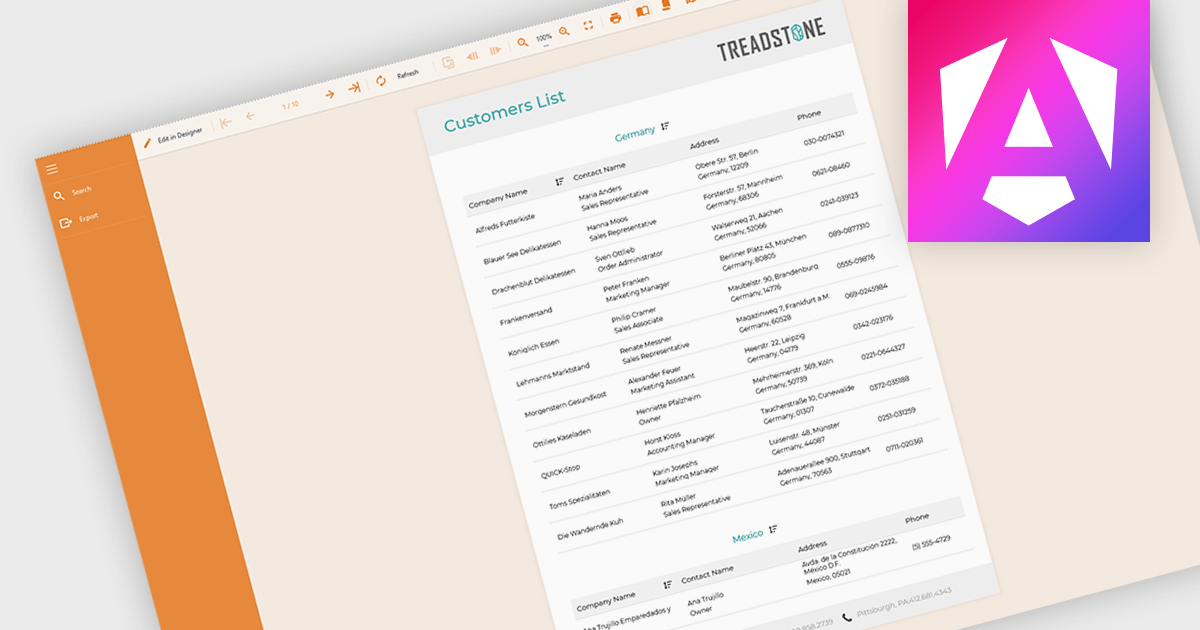
Filtering and grouping report data empowers users to drill down into specific details and identify trends. By filtering data based on relevant criteria, users can isolate subsets of information, while grouping organizes data points based on shared characteristics, allowing for comparisons and pattern recognition within the larger dataset. This combined functionality fosters a deeper understanding of the information being presented.
Several Angular reporting controls offer the ability to filter and group data including:
For an in-depth analysis of features and price, visit our Angular reporting controls comparison.
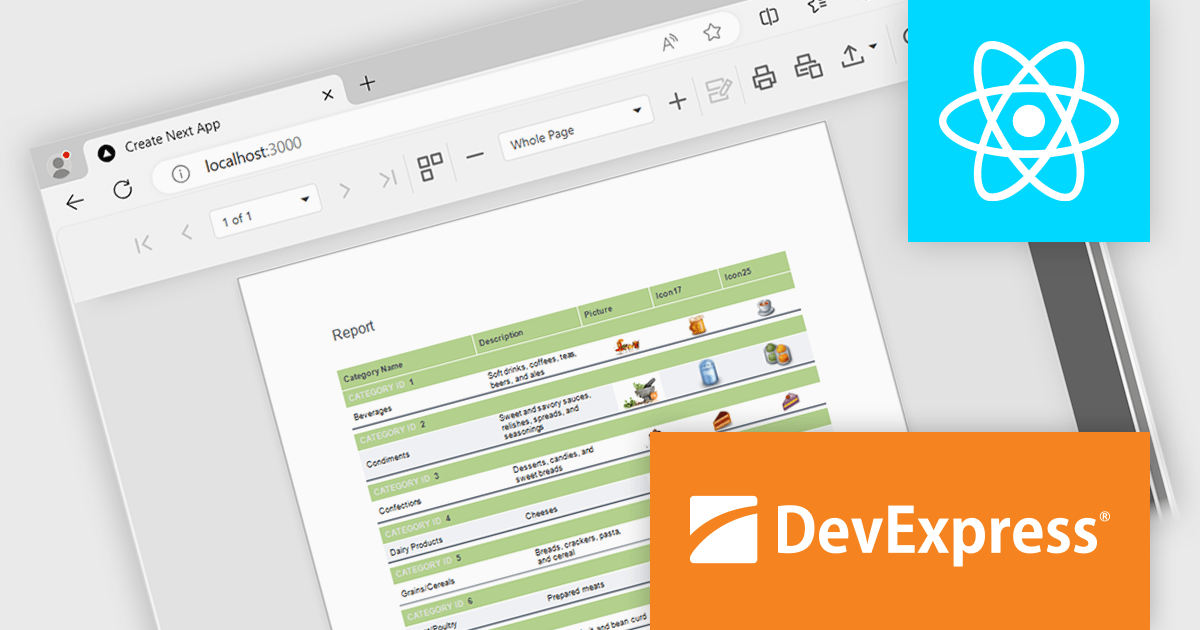
DevExpress Reporting is a powerful, versatile tool for building reports in the .NET ecosystem. It lets you design professional-looking reports with a visual editor, connect to various data sources, and customize them with charts, graphs, and interactive elements. Whether you're creating invoices, sales summaries, or complex dashboards, DevExpress Reporting offers the flexibility and features to bring your data to life in a clear and insightful way. It integrates seamlessly with WinForms, WPF, Web, and Blazor applications, making it a popular choice for developers who need a robust reporting solution.
The DevExpress Reporting 24.1 release introduces a native React Report Viewer component that streamlines the integration of reporting into React applications. This new component leverages the proven architecture of the DevExpress Angular Report Viewer, eliminating the need for JavaScript wrappers and ensuring a more responsive and performant user experience. This translates to benefits like faster rendering and a more intuitive user interface for interacting with reports within React applications, making it ideal for scenarios requiring seamless report viewing and interaction within complex React dashboards or data analysis tools.
To see a full list of what's new in version 24.1, see our release notes.
DevExpress Reporting is licensed per developer and is available as a Perpetual License with a 12 month support and maintenance subscription. See our DevExpress Reporting licensing page for full details.
DevExpress Reporting is available to buy in the following products:
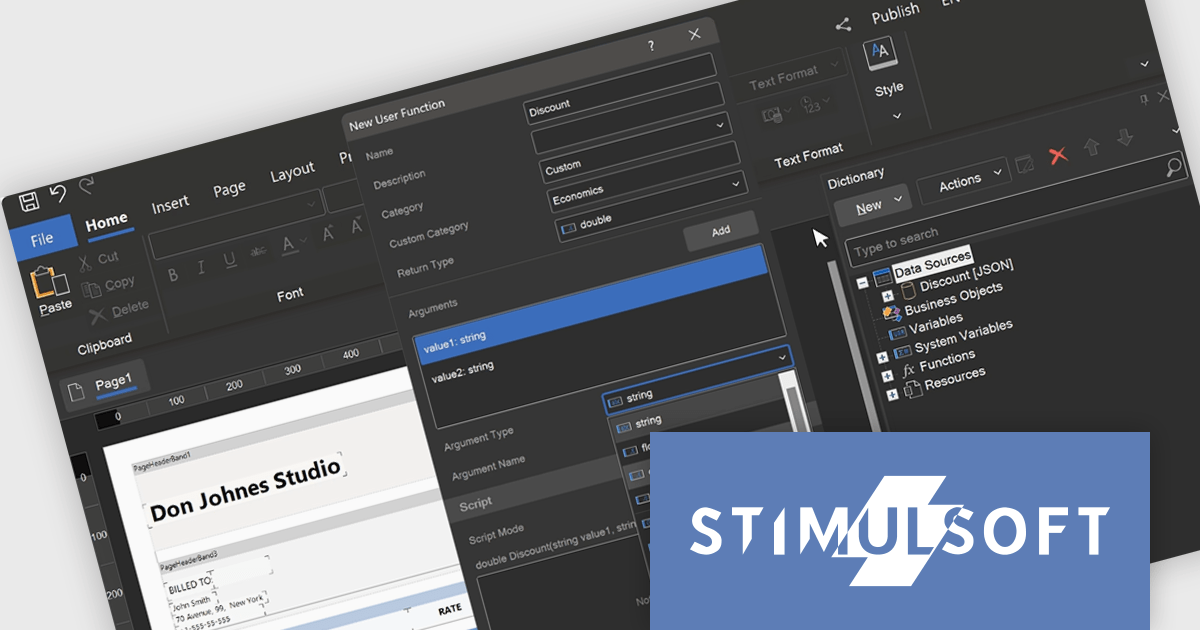
Stimulsoft Reports.WEB is a cross-platform reporting solution designed for integration within web applications. It leverages a client-server architecture for report generation, viewing, printing, and exporting directly in web browsers. Its powerful .NET report engine offers efficient report processing, a user-friendly HTML5 report designer for building reports with various data sources and visualizations, and an interactive HTML5 viewer for seamless report display within web applications. This integration allows developers to implement robust reporting functionalities without browser plugins or additional client-side dependencies.
The Stimulsoft Reports.WEB 2024.3 release empowers developers with user-defined functions within the data dictionary. This functionality extends report capabilities by allowing creation of custom logic using either the visual programming tool Blockly or directly in supported scripting languages. These user-defined functions can be seamlessly integrated into reports enabling developers to address complex calculations, data transformations, or custom formatting logic without code modifications in the main application. This streamlines development, promotes code reusability, and fosters a more dynamic reporting environment.
To see a full list of what's new in version 2024.3, see our release notes.
Stimulsoft Reports.WEB is licensed per developer and is available as a Perpetual license with 1 year support and maintenance. See our Stimulsoft Reports.WEB licensing page for full details.
Stimulsoft Reports.WEB is available in the following products:
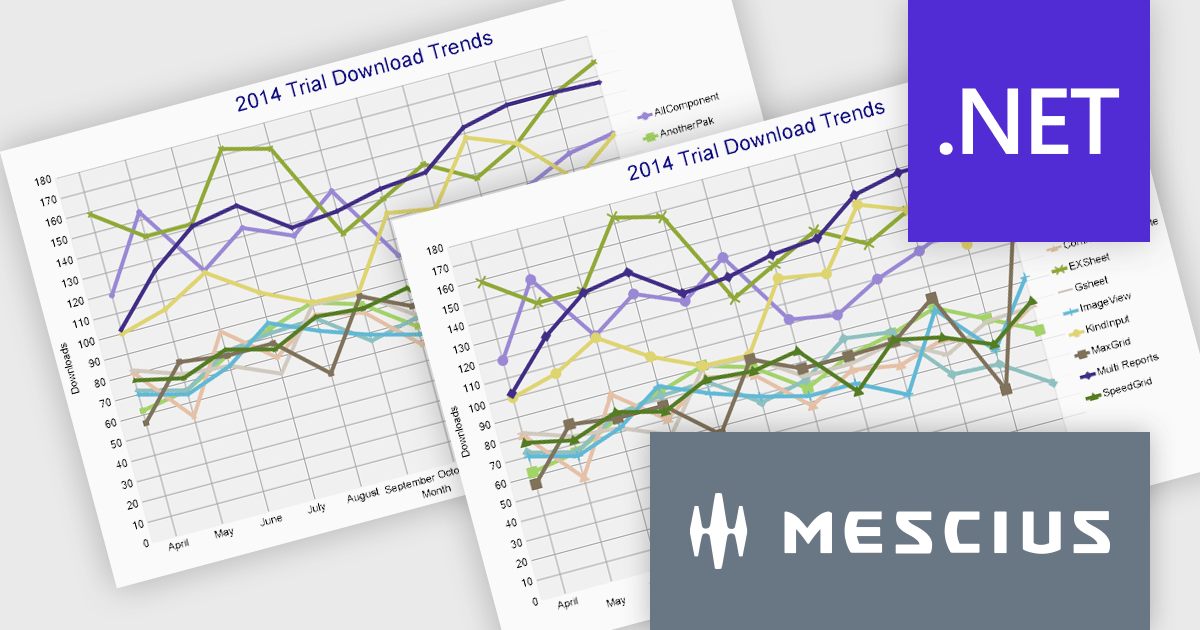
ActiveReports.NET from MESCIUS (formerly GrapeCity) is a comprehensive reporting solution for developers building applications in the .NET framework. It empowers you to design and deliver visually appealing reports through user-friendly designers and a wide range of controls. ActiveReports simplifies report creation and distribution with a versatile API, rich data source connectivity, and support for multiple export formats. This translates to increased developer productivity and improved end-user experience with powerful reporting functionalities within your .NET applications.
The ActiveReports.NET 18.1 update adds additional attributes to improve the customization and visual representation of charts in RDLX, Page, and Dashboard reports. The new LabelRowCount property, applies to the X-axis of charts and allows you to choose the number of rows for axis labels, enabling multi-row layouts for improved label display and organization. The new SymbolSize property allows you to change the size of plot symbols, giving you more control over chart data presentation. It is compatible with the following chart types: Line chart, Radar line chart, Radar scatter chart, Radar bubble chart, Scatter chart, and Bubble chart. These modifications are intended to improve the clarity and adaptability of chart displays within your .NET Report applications.
To see a full list of what's new in 18.1, see our release notes.
ActiveReports.NET is licensed per developer and is available with or without a 12 month support and maintenance subscription. See our ActiveReports.NET licensing page for full details.
Learn more on our ActiveReports.NET product page.
전화 : 00798 14 800 6332
팩스 : +1 770 250 6199


