


공식 공급 업체
200 이상의 소프트웨어 개발처와 판매 계약을 맺은 공인 디스트리뷰터로서 합법적인 라이선스를 제공합니다.
모든 브랜드 보기.
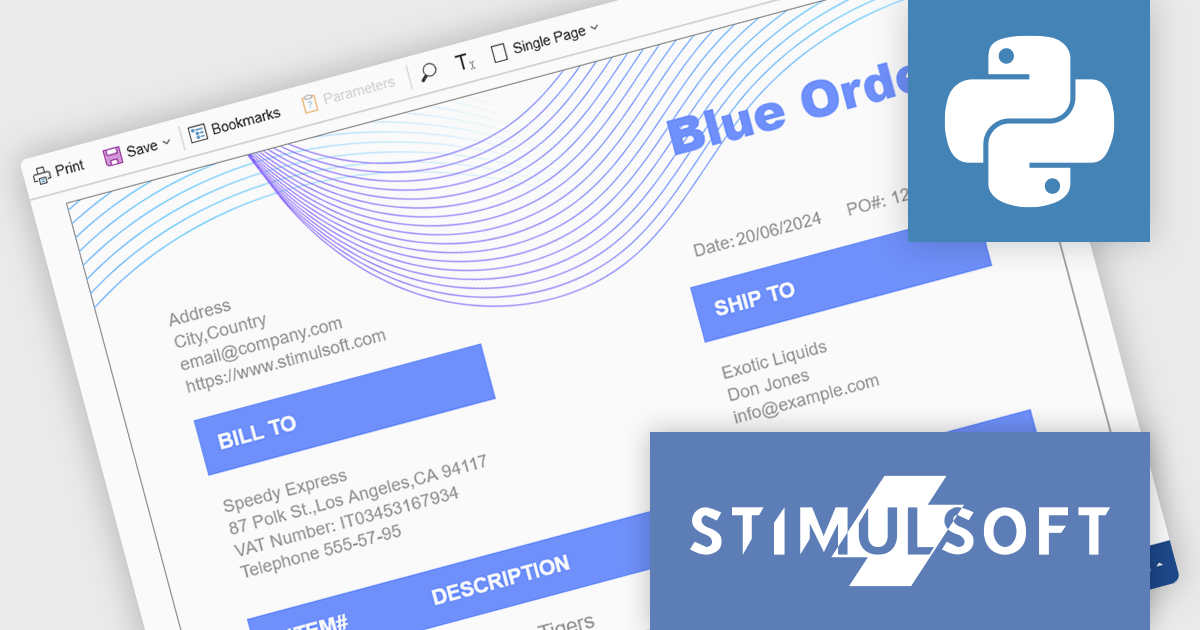
Stimulsoft Reports.PYTHON provides a collection of tools for creating, viewing, exporting, and printing reports within your Python applications. It allows you to connect to various data sources and leverage client-server technology for efficient report generation. Additionally, Stimulsoft offers powerful features for visualizing and analyzing your data.
The Stimulsoft Reports.PYTHON 2024.3 release enables developers to generate and export reports entirely on the Python server, offering greater control and flexibility. All existing reporting tool events and Python data adapters remain fully functional within this server-side environment. Server-side rendering unlocks several advantages, reducing client-side load, improving report generation speed, and enhancing security by keeping sensitive data on the server. It caters to scenarios where complex reports or data privacy concerns necessitate a server-centric approach.
To see a full list of what's new in version 2024.3, see our release notes.
Stimulsoft Reports.PYTHON is licensed per developer and is available as a Perpetual license with 1 year support and maintenance. See our Stimulsoft Reports.PYTHON licensing page for full details.
Stimulsoft Reports.PYTHON is available in the following products:
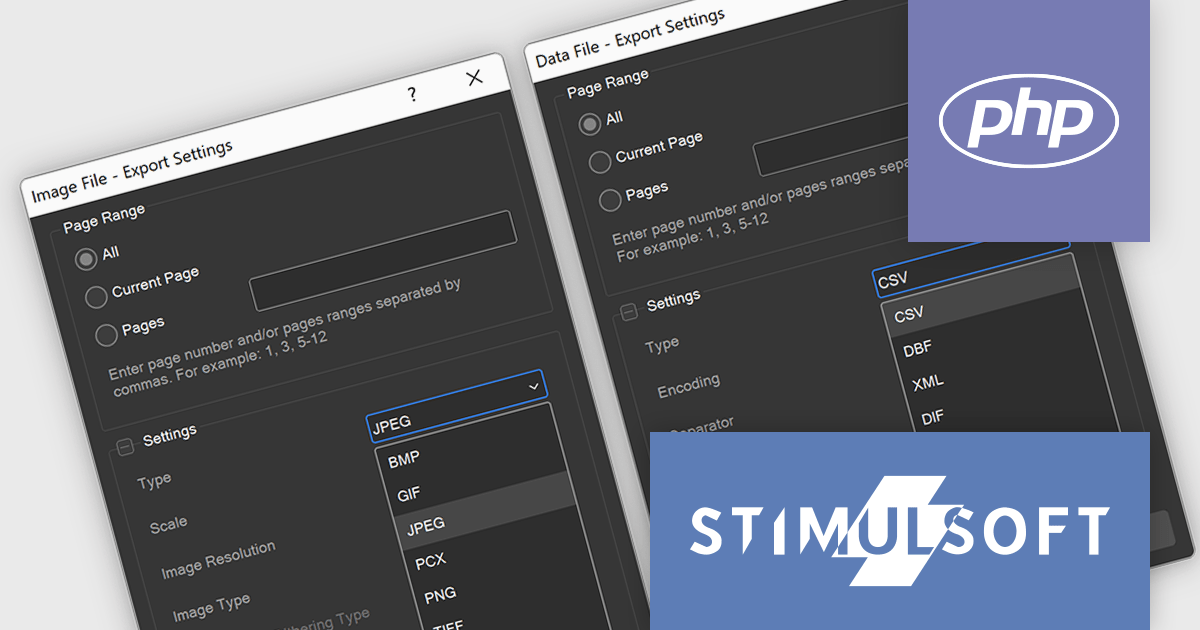
Stimulsoft Reports.PHP is a reporting tool designed to be embedded within PHP applications. It offers a client-server architecture for generating, viewing, printing, and exporting reports online. The solution includes a JavaScript report engine for fast execution, a native JavaScript report designer for building reports with various data sources and visualizations, and a PHP server-side component for data processing. This integration allows developers to seamlessly add robust reporting functionality to their PHP applications.
The Stimulsoft Reports.PHP 2024.3 update significantly expands report output options. Reports can now be exported to various data-oriented formats including CSV, JSON, XML, and legacy options like DBF, DIF, and SYLK. This allows for seamless data exchange and integration with other applications. Furthermore, reports can be exported as a wide range of image formats like BMP, GIF, JPEG, and PNG, providing flexibility for visual representation. This expanded functionality caters to diverse needs, simplifying data exchange, visual presentation, and document sharing.
To see a full list of what's new in version 2024.3, see our release notes.
Stimulsoft Reports.PHP is licensed per developer and is available as a Perpetual license with 1 year support and maintenance. See our Stimulsoft Reports.PHP licensing page for full details.
Stimulsoft Reports.PHP is available in the following products:
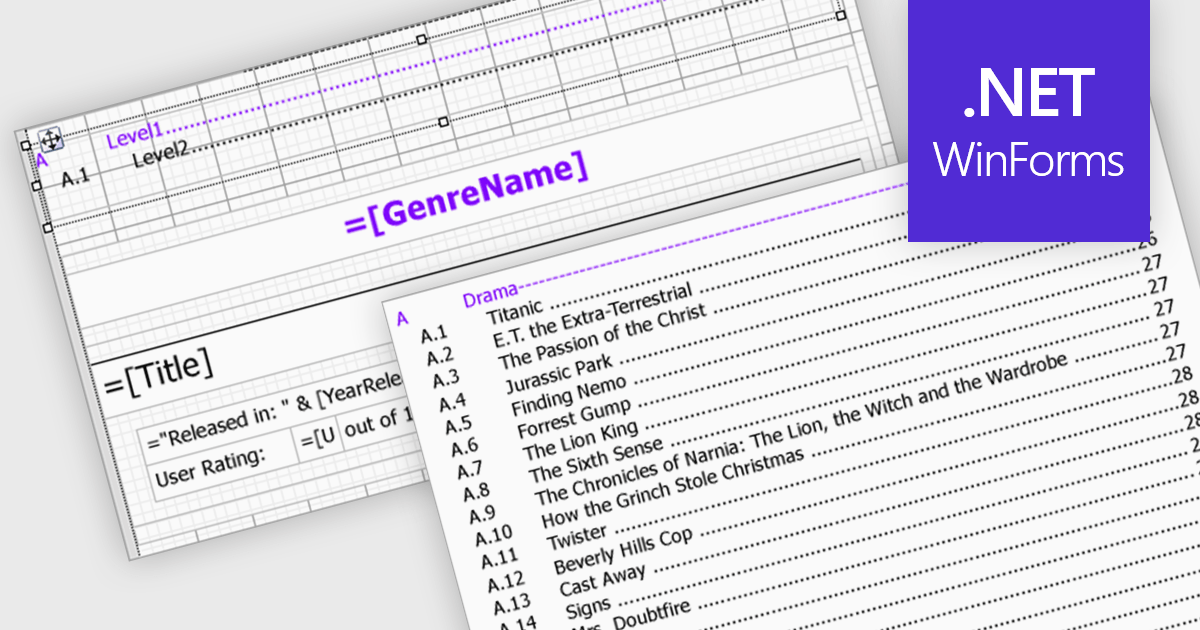
Reporting components streamline document creation by offering automatic Table of Contents (TOC) generation. This feature scans a document for designated headings, like titles and subtitles, and builds a clickable index at the beginning. This not only enhances professionalism but also improves user experience by allowing for easy navigation within lengthy reports. Automatic TOC generation proves particularly valuable for complex documents, research papers, and technical manuals, where readers might need to quickly jump to specific sections.
Several WinForms reporting components support Table of Contents (TOC) features, including:
For an in-depth analysis of features and price, visit our comparison of WinForms reporting components.

ActiveReportsJS by MESCIUS is a JavaScript reporting toolkit that empowers developers to design and embed interactive reports within web applications. It offers a standalone report designer for crafting reports and a JavaScript report viewer component for seamless integration into web frameworks like React or vanilla JavaScript. This solution streamlines report creation, facilitates data visualization, and delivers a user-friendly report experience.
The ActiveReportsJS 5.0 update modernizes the development experience by refreshing the look and feel of both the Report Designer and Report Viewer components with new icons and colors. This enhances clarity and consistency and improves the design environment. Improved theming capabilities empower you to effortlessly apply pre-defined themes or customize the designer's appearance to match your application's branding, fostering a more cohesive user experience within your web applications.
To see a full list of what's new in 5.0, see our release notes.
ActiveReportsJS is licensed on an annual subscription or perpetual basis and is available as a Single Deployment License for non-commercial use, and as a Single Domain License or Unlimited Domain License for commercial and/or SaaS use. See our ActiveReportsJS licensing page for full details.
Learn more on our ActiveReportsJS product page.
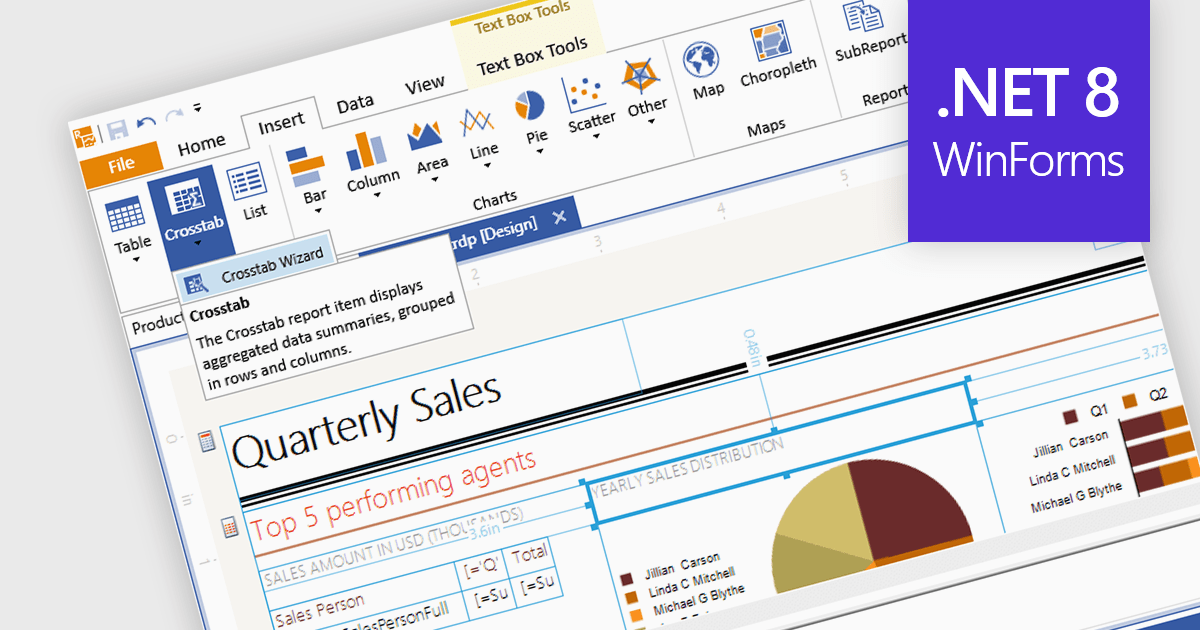
A visual report designer is a software tool that enables the creation of data-driven reports through an intuitive graphical user interface, allowing users to drag and drop data elements and design components onto a canvas. This approach eliminates the need for coding knowledge and thereby simplifies the report creation process. These tools offer benefits such as increased accessibility for non-technical users, improved design efficiency, and the ability to produce clear and informative reports that effectively communicate complex data.
Several .NET 8 WinForms reporting components includes a visual report designer, including:
For an in-depth analysis of features and price, visit our comparison of .NET 8 WinForms reporting components.
전화 : 00798 14 800 6332
팩스 : +1 770 250 6199


