


공식 공급 업체
200 이상의 소프트웨어 개발처와 판매 계약을 맺은 공인 디스트리뷰터로서 합법적인 라이선스를 제공합니다.
모든 브랜드 보기.
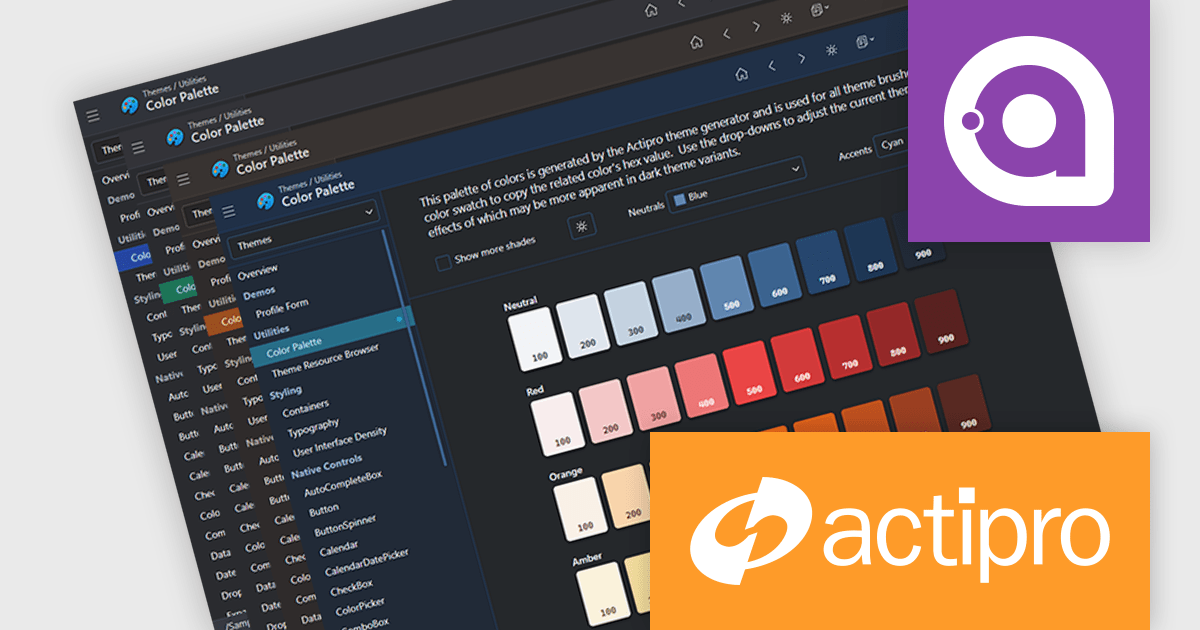
Actipro Avalonia UI Pro is a suite of professionally designed UI controls, themes, and components specifically built for the Avalonia UI framework. It empowers developers to craft beautiful, modern cross-platform applications while leveraging their existing C# and WPF skills. Actipro offers a range of controls from essential navigation and data visualization components to advanced charting and scheduling features, all adhering to its signature high-quality design and seamless integration with Avalonia.
The Avalonia Controls v25.2.1 update adds color palette customization, enabling developers to define and adjust the factory responsible for generating theme color palettes. This enhancement allows precise control over color ramps and the ability to apply consistent tinting across the entire theme, ensuring applications can adopt any required brand or design specification. By simplifying the process of modifying palette colors, the update reduces the effort needed to achieve uniform styling across components and provides flexibility to create distinctive appearances that align with both functional and aesthetic requirements.
To see a full list of what's new in 25.2.1, see our release notes.
Actipro Avalonia UI Pro is licensed per developer and is available as a Perpetual license with 1 year support and maintenance. See our Actipro Avalonia UI Pro licensing page for full details.
Learn more on our Actipro Avalonia UI Pro product page.
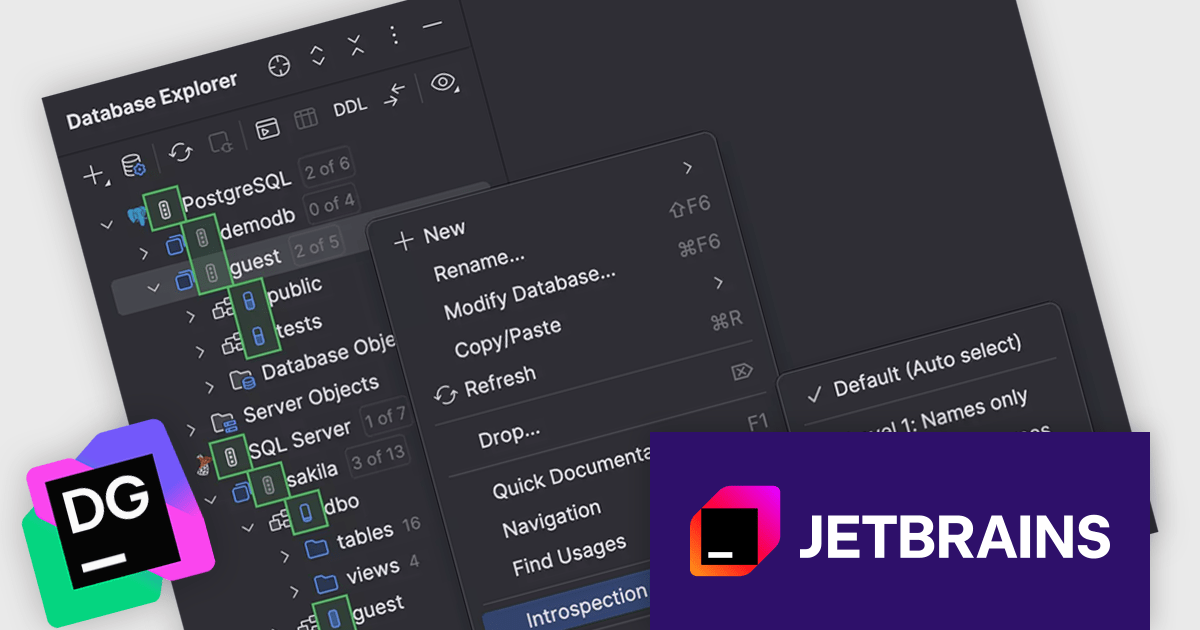
DataGrip is a multi-engine database environment that supports MySQL, PostgreSQL, Microsoft SQL Server, Oracle, Sybase, DB2, SQLite, HyperSQL, Apache Derby and H2. It includes an editor that provides intelligent coding assistance such as auto-completion, analysis and navigation. It also features a query console for running and profiling queries.
The JetBrains DataGrip 2025.2 release extends its 'introspection by levels' feature to support PostgreSQL and Microsoft SQL Server. This capability optimizes how metadata is loaded by dynamically adjusting the depth of introspection based on the size of the database. For larger environments, this means users no longer need to wait for a full metadata load before interacting with the database. This change is particularly helpful for teams working with extensive schemas, where full introspection could previously slow down the interface or delay access. Now, essential metadata is prioritized, allowing developers and database administrators to begin tasks like writing queries or inspecting structure more quickly.
To see a full list of what's new in version 2025.2, see our release notes.
DataGrip is licensed per user, and is available as a commercial annual subscription license. We can supply new subscriptions, subscription renewals, lapsed renewals, and additional user licenses. See our DataGrip licensing page for full details.
DataGrip is available to buy in the following products:
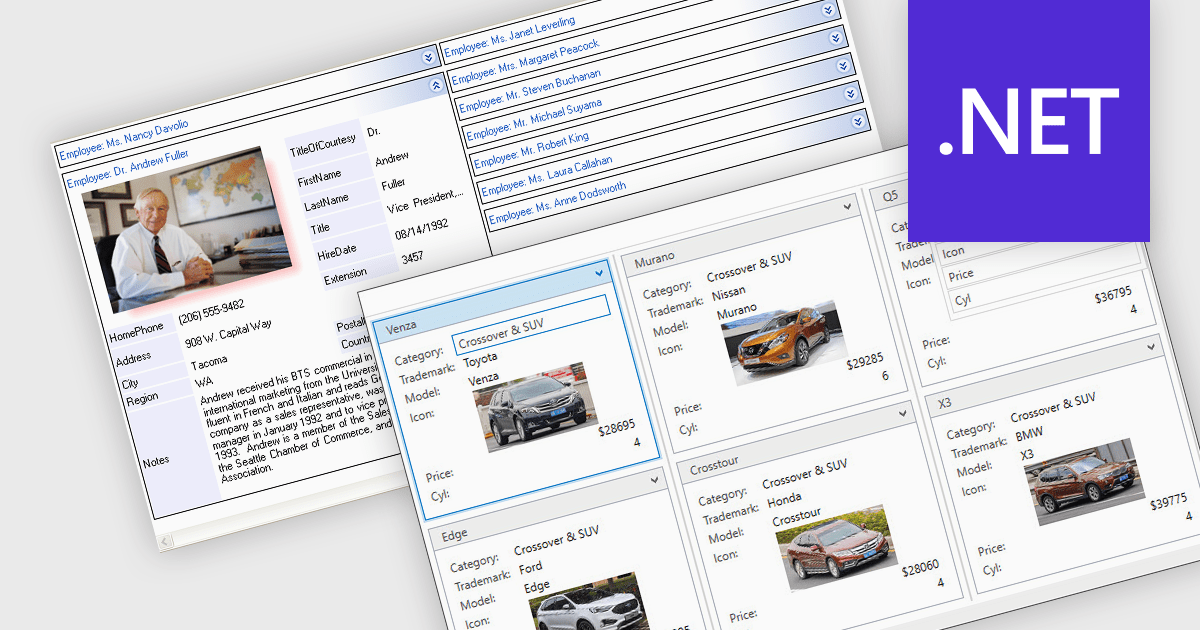
Card view is a grid layout option that displays data as a series of individual cards arranged in rows and columns, rather than as traditional table rows. Each card encapsulates related fields, often with custom formatting and embedded controls, allowing for more visual and flexible presentation of complex data. This format is especially beneficial in scenarios where users need to review, interact with, or compare structured records involving rich content or media in a more engaging and user-friendly layout.
Several .NET grid components allow you to use card view, including:
For an in-depth analysis of features and price, visit our comparison of .NET grid components.
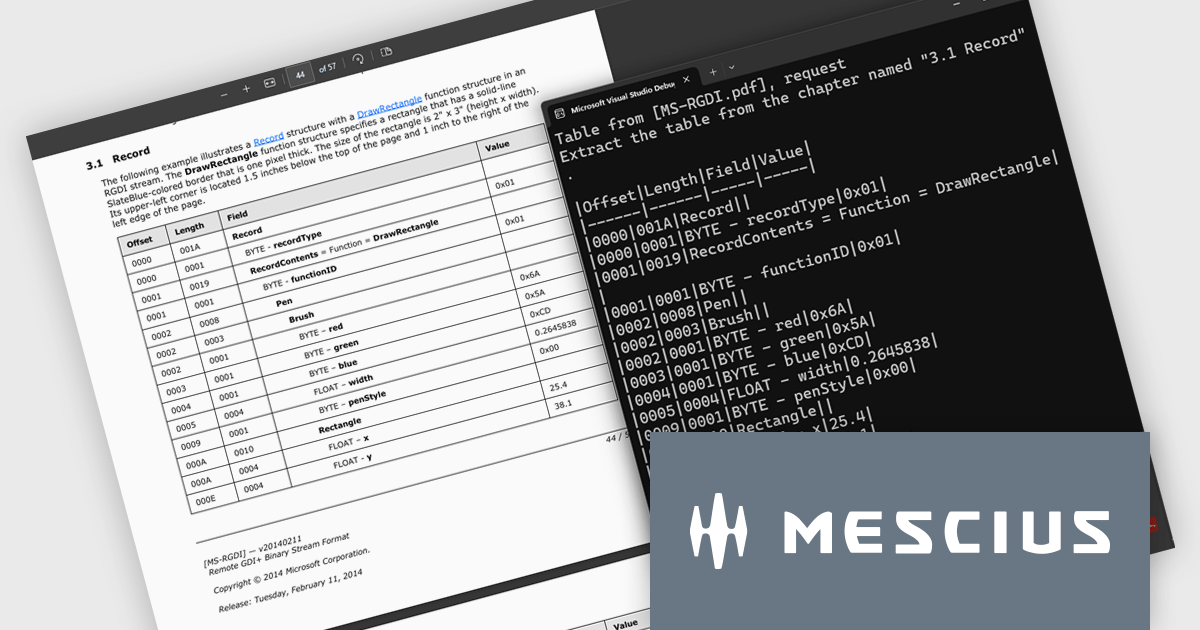
Document Solutions for PDF (DsPdf) by MESCIUS is a software development toolkit that provides .NET Core libraries and a JavaScript PDF viewer for manipulating and displaying PDFs. DsPdf enables developers to create, edit, annotate, and redact PDF documents directly within web applications. The included DsPdfViewer component offers a feature-rich, cross-platform solution for viewing and interacting with PDFs in modern browsers on various operating systems, including mobile devices.
The Document Solutions for PDF v8.2 update introduces a new AI-powered capability to extract tables from documents, enabling developers to convert unstructured tabular data in PDFs into structured, machine-readable formats with ease. By leveraging natural language prompts through OpenAI or Azure OpenAI services, this feature eliminates the need for manual parsing or coordinate-based extraction, reducing development effort. It provides reliable output even from PDFs with complex layouts or inconsistent formatting.
To see a full list of what's new in version 8.2, see our release notes.
Document Solutions for PDF is licensed per developer and is available in several license options for differing distribution needs. Team licenses are also available for multiple developers within the same organization. See our Document Solutions for PDF licensing page for full details.
Document Solutions for PDF is available to buy individually or as part of Document Solutions .NET Bundle.
CodeCanvas is JetBrains’ answer to the growing need for scalable, cloud-based development setups that don’t compromise on control or tooling preferences. As a cloud development environment (CDE) orchestrator, it allows teams to spin up consistent and fully configured development environments using their favorite JetBrains IDEs - all within their own infrastructure. This setup significantly reduces the overhead of environment mismatches and local setup time, making it easier for developers to start writing code immediately, no matter where they’re working from.
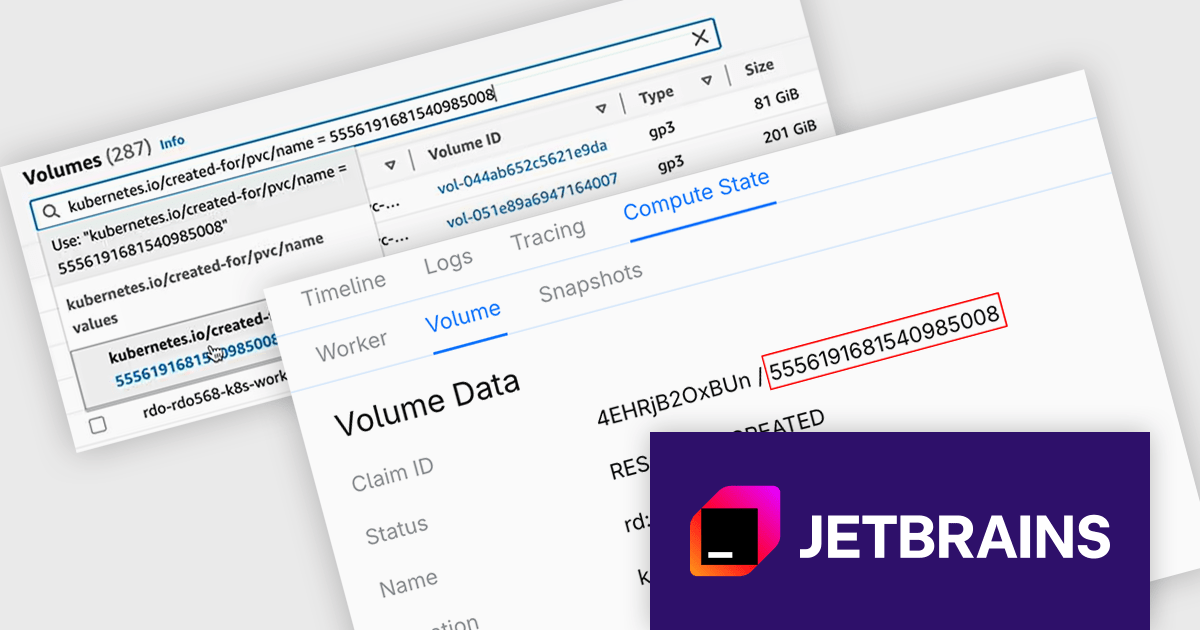
The CodeCanvas 2025.3 release adds the ability to recover data from failed development environments. If an environment fails to start - whether due to configuration errors, system issues, or other problems - you can now create a dedicated recovery environment that retains the volume of the original setup. This means that any unpushed code or unsaved data left behind can still be accessed, reviewed, and preserved. It's a practical safeguard for developers working in cloud-based workflows, helping to reduce the risk of lost work and ensuring continuity across development sessions.
To see a full list of what's new in version 2025.3, see our release notes.
CodeCanvas is available as an annual subscription license. It uses a floating license model governed by Daily Active Users (DAU). Any user can access CodeCanvas as long as the number of users active on any single day does not exceed the total licenses purchased. The license pool resets every 24 hours, enabling different team members to rotate access. See our CodeCanvas licensing page for full details.
For more information, see our CodeCanvas product page.
전화 : 00798 14 800 6332
팩스 : +1 770 250 6199


