


공식 공급 업체
200 이상의 소프트웨어 개발처와 판매 계약을 맺은 공인 디스트리뷰터로서 합법적인 라이선스를 제공합니다.
모든 브랜드 보기.
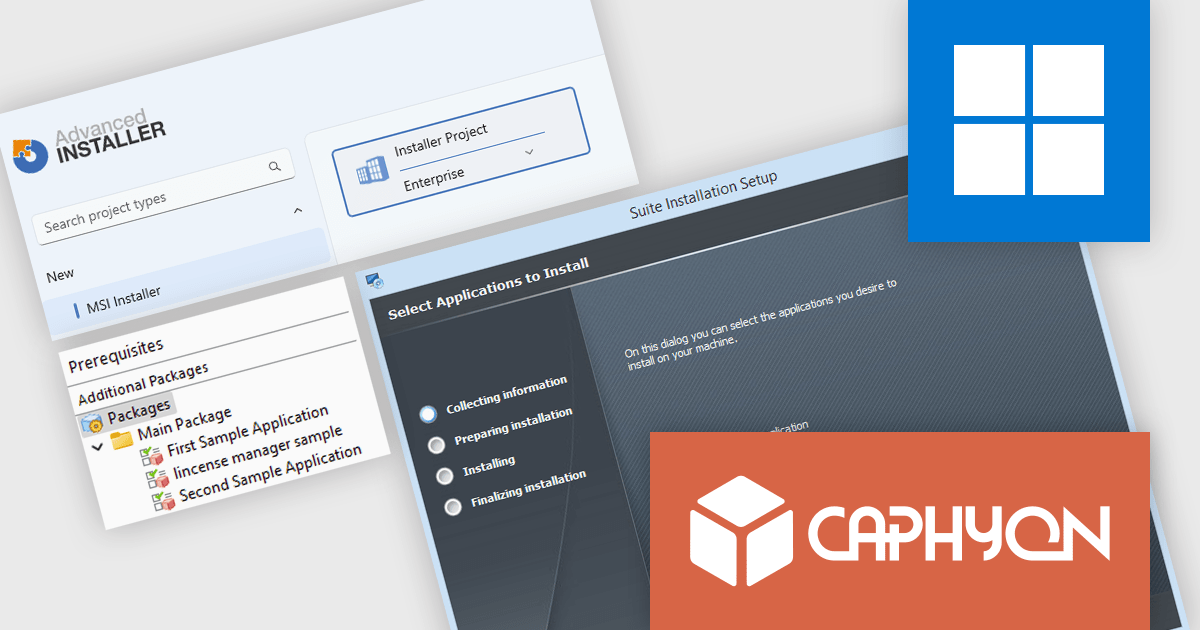
Advanced Installer by Caphyon is a versatile software packaging tool used by developers, IT administrators, and software vendors to create reliable, professional-grade installation packages. It simplifies the deployment process for applications across various platforms, offering features like built-in compliance checks, configuration of server roles, and seamless integration with development frameworks. By automating complex tasks, it helps teams save time and reduce errors, making it an indispensable tool for deploying enterprise applications, client-server solutions, and cloud-connected software.
The Advanced Installer 23.0 update introduces the new Suite Installer, allowing developers to bundle multiple applications into a single, customizable installer that reflects their brand identity. This enhancement simplifies deployment by centralizing installation and updates, while offering end users a more refined experience where they can select only the applications they need. By combining flexibility for users with efficiency for developers, the Suite Installer reduces complexity, saves time, and ensures a more professional and consistent delivery process.
To see a full list of what's new in version V23.0, see our release notes.
Advanced Installer is licensed per user and is available as an annual or perpetual license with 1 year support and maintenance. See our Advanced Installer licensing page for full details.
For more information, visit our Advanced Installer product pages:
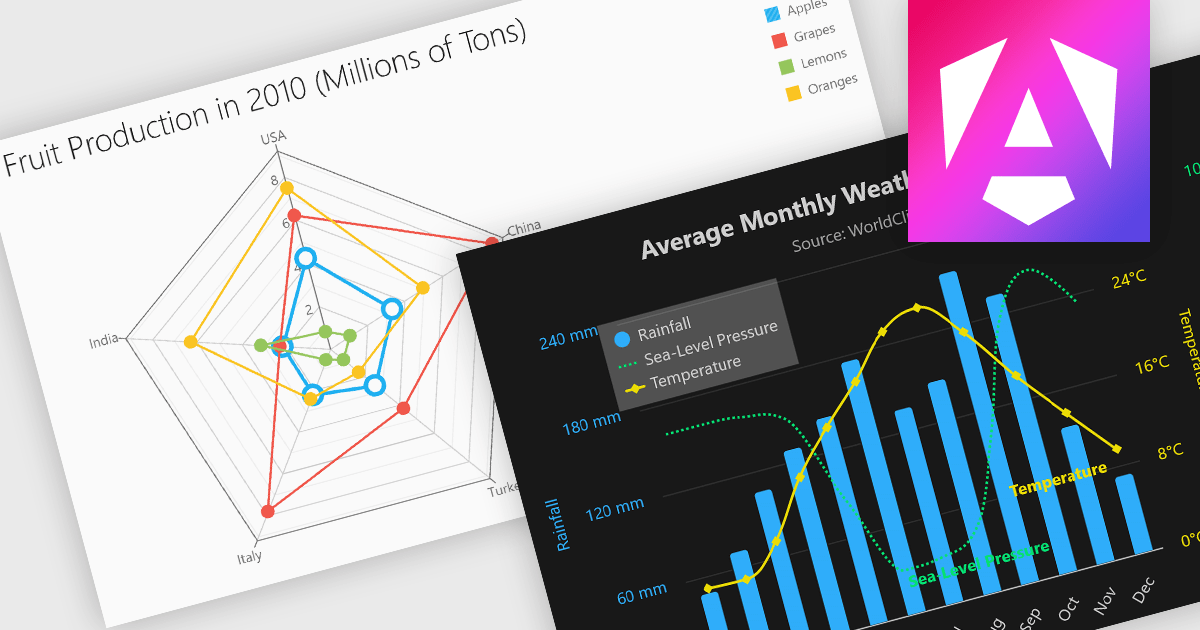
Multi-dimensional and relationship charts allow developers to present complex data structures and inter-variable relationships in a way that’s visually intuitive and analytically powerful. These chart types are essential for exploring correlations, comparing grouped metrics, and visualizing distributions across multiple dimensions. They are commonly used in statistical dashboards, performance analysis tools, and scientific applications where simple line or bar charts aren’t sufficient to capture the full context of the data.
Common charts include:
For an in-depth analysis of features and price, visit our Angular Chart components comparison.
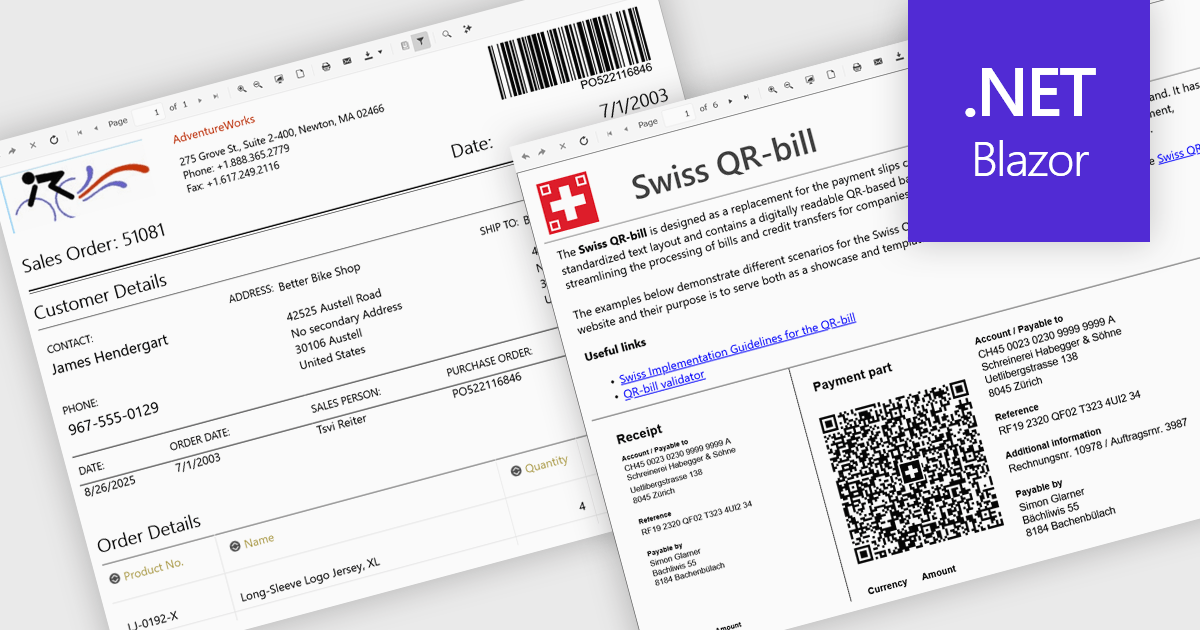
Adding barcodes to reports means embedding machine-readable codes like QR or Code 128 directly into printed or digital outputs. These can be scanned by barcode readers, making data entry faster, reducing errors, and improving traceability. Barcodes also support integration with inventory, logistics, or ERP systems. This feature is especially useful in manufacturing, retail, healthcare, and supply chain environments where accuracy and speed are essential.
Several .NET Blazor Reporting controls include Barcodes including:
For an in-depth analysis of features and price, visit our comparison of .NET Blazor Reporting Controls.
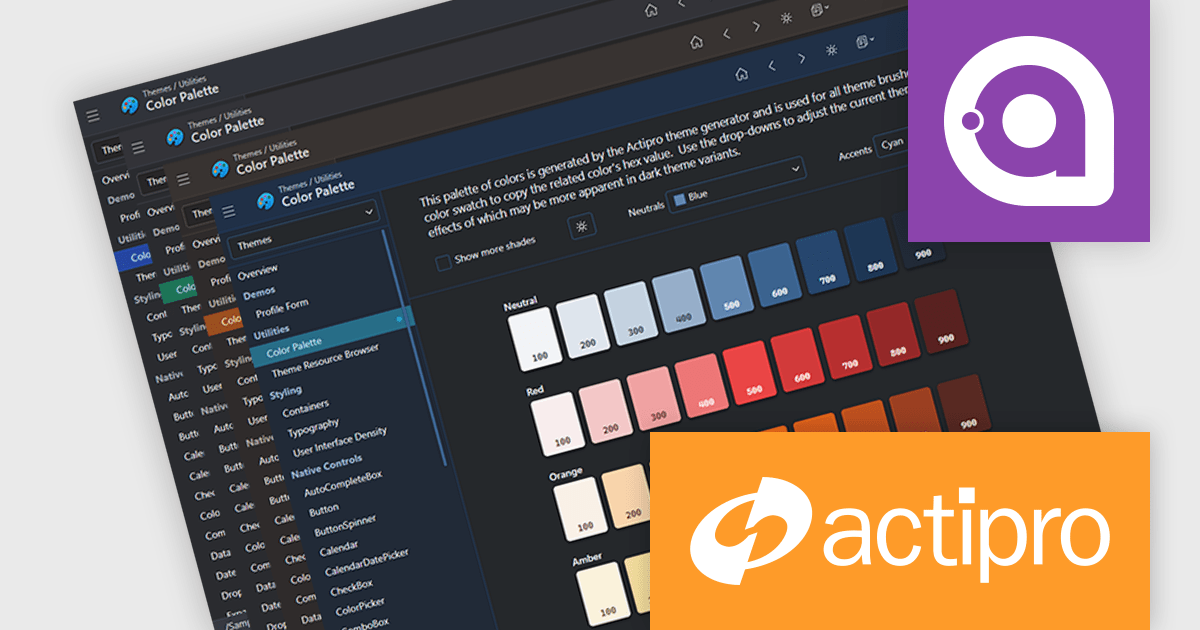
Actipro Avalonia UI Pro is a suite of professionally designed UI controls, themes, and components specifically built for the Avalonia UI framework. It empowers developers to craft beautiful, modern cross-platform applications while leveraging their existing C# and WPF skills. Actipro offers a range of controls from essential navigation and data visualization components to advanced charting and scheduling features, all adhering to its signature high-quality design and seamless integration with Avalonia.
The Avalonia Controls v25.2.1 update adds color palette customization, enabling developers to define and adjust the factory responsible for generating theme color palettes. This enhancement allows precise control over color ramps and the ability to apply consistent tinting across the entire theme, ensuring applications can adopt any required brand or design specification. By simplifying the process of modifying palette colors, the update reduces the effort needed to achieve uniform styling across components and provides flexibility to create distinctive appearances that align with both functional and aesthetic requirements.
To see a full list of what's new in 25.2.1, see our release notes.
Actipro Avalonia UI Pro is licensed per developer and is available as a Perpetual license with 1 year support and maintenance. See our Actipro Avalonia UI Pro licensing page for full details.
Learn more on our Actipro Avalonia UI Pro product page.
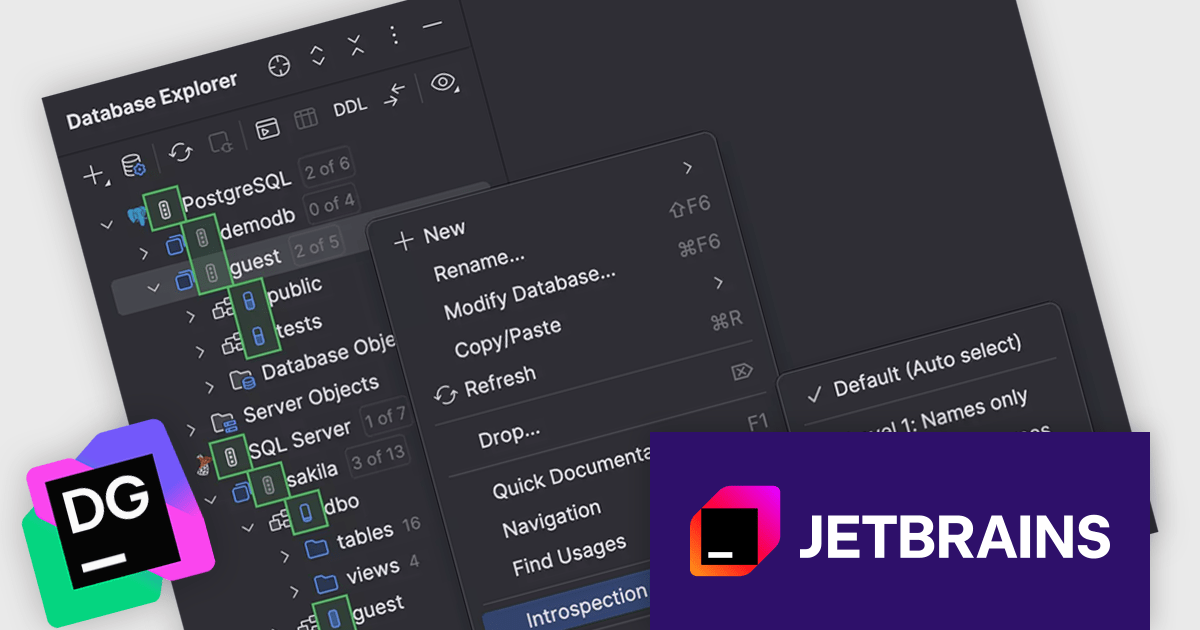
DataGrip is a multi-engine database environment that supports MySQL, PostgreSQL, Microsoft SQL Server, Oracle, Sybase, DB2, SQLite, HyperSQL, Apache Derby and H2. It includes an editor that provides intelligent coding assistance such as auto-completion, analysis and navigation. It also features a query console for running and profiling queries.
The JetBrains DataGrip 2025.2 release extends its 'introspection by levels' feature to support PostgreSQL and Microsoft SQL Server. This capability optimizes how metadata is loaded by dynamically adjusting the depth of introspection based on the size of the database. For larger environments, this means users no longer need to wait for a full metadata load before interacting with the database. This change is particularly helpful for teams working with extensive schemas, where full introspection could previously slow down the interface or delay access. Now, essential metadata is prioritized, allowing developers and database administrators to begin tasks like writing queries or inspecting structure more quickly.
To see a full list of what's new in version 2025.2, see our release notes.
DataGrip is licensed per user, and is available as a commercial annual subscription license. We can supply new subscriptions, subscription renewals, lapsed renewals, and additional user licenses. See our DataGrip licensing page for full details.
DataGrip is available to buy in the following products:
전화 : 00798 14 800 6332
팩스 : +1 770 250 6199


