


공식 공급 업체
200 이상의 소프트웨어 개발처와 판매 계약을 맺은 공인 디스트리뷰터로서 합법적인 라이선스를 제공합니다.
모든 브랜드 보기.
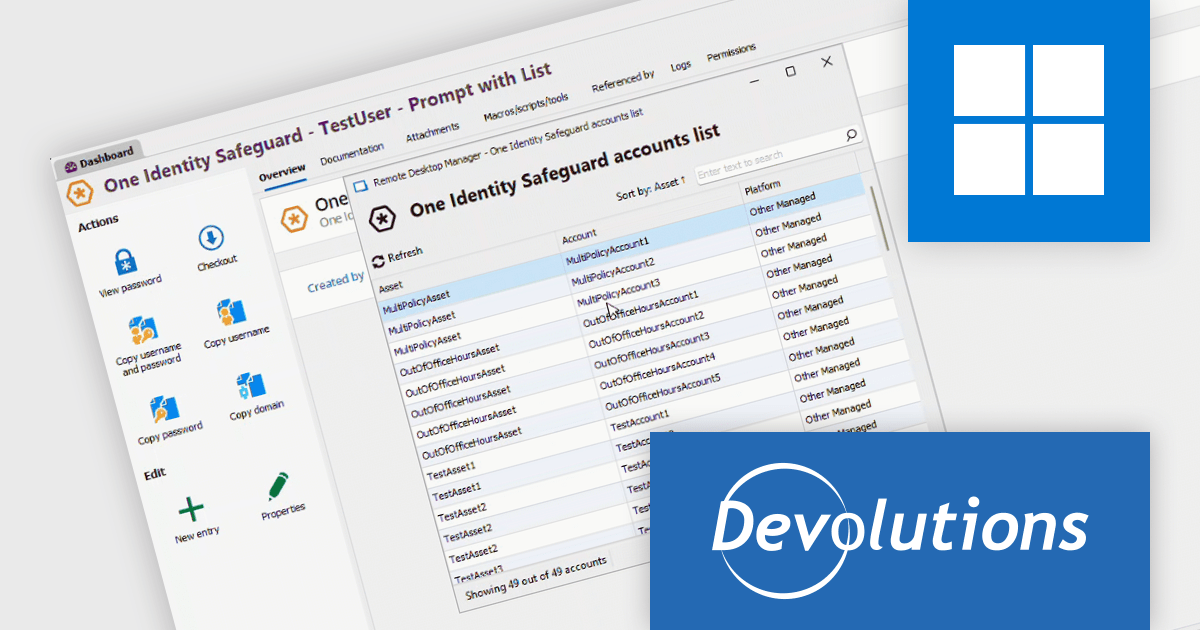
Remote Desktop Manager (RDM) by Devolutions (available in Windows, macOS or Linux editions) is a centralized platform designed for managing and securing remote connections and credentials for authorized users across various environments. It supports an extensive list of technologies, including remote desktops, virtual private networks (VPNs), and secure shell (SSH) tunnels, and features centralized password vaults, user-specific vaults, and administrative password sharing. This cross-platform management tool also allows you to perform audits and create reports, as well as offering mobile and offline access, and integrated virtualization consoles. RDM provides a comprehensive solution for IT professionals and developers who need to streamline access to servers, virtual machines, and network devices.
The Remote Desktop Manager 2024.3.10.0 update (Windows Edition) expands its Privileged Access Manager (PAM) vendor support with the integration of One Identity Safeguard for Privileged Passwords. This enhancement allows users to retrieve One Identity credentials and inject them into RDM sessions, and creates a more intuitive user experience when it comes to endpoint connections. By leveraging Safeguard's vaulting and access control features, teams can better protect sensitive credentials, reduce the risk of unauthorized access, and ensure compliance with organizational security policies, all while maintaining seamless and efficient workflows for remote connections and system administration tasks.
To see a full list of what's new in 2024.3.10.0, see our release notes.
Remote Desktop Manager is licensed per user and is available as a 1 or 3 year subscription license, however perpetual licenses are available upon request. Subscriptions include maintenance and perpetual licenses can have maintenance added, this provides new versions and technical support for the duration of the subscription/maintenance period. See our Remote Desktop Manager licensing page for full details.
For more information, visit our Remote Desktop Manager product page.
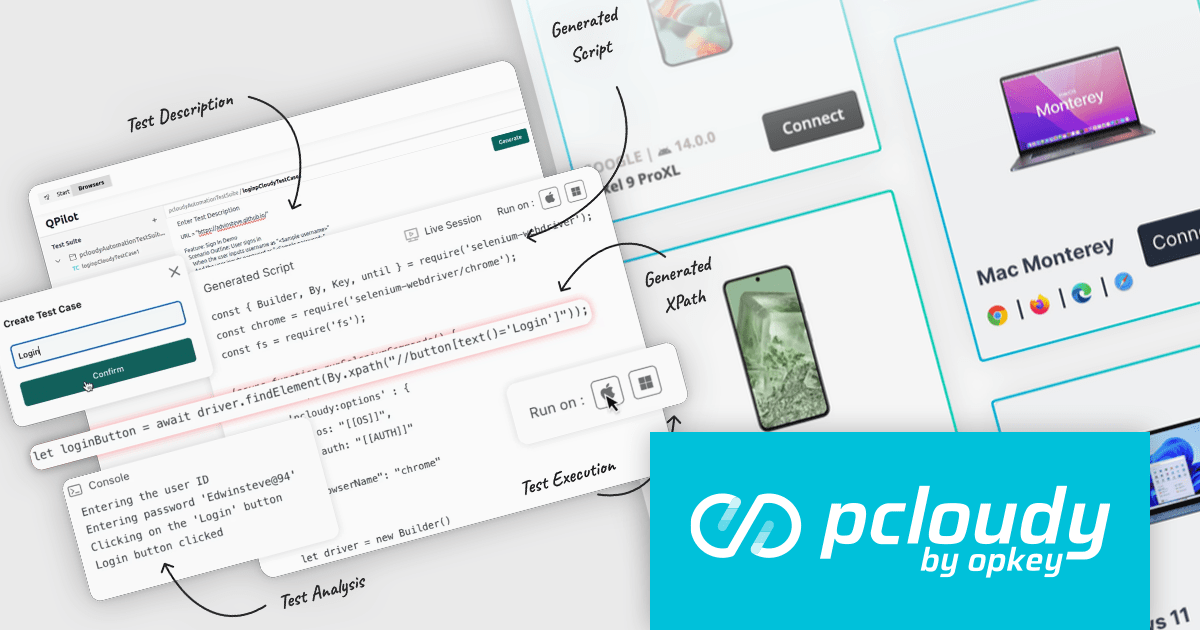
Pcloudy is a unified app testing platform that helps developers and testers ensure the quality and functionality of their applications across a wide range of devices and browsers. It provides a cloud-based infrastructure for manual and automated testing, offering access to thousands of real devices and browser combinations.
The Pcloudy 6.12 release supports advanced testing across both web and mobile applications, ensuring consistent functionality and quality across different platforms and devices. By intelligently analyzing testing scenarios and anticipating potential issues, QPilot.AI ensures comprehensive coverage across platforms, improving both speed and quality. Its scalability allows for large-scale testing, making it ideal for enterprises, while its ability to lower costs through automation further optimizes the testing process. This powerful solution boosts app quality assurance, driving efficiency and reliability in software development.
To see a full list of what's new in 6.12, see our release notes.
Pcloudy is offered as a 1 Year Subscription, licensed per user, per parallel session. Licenses are available for Manual or Automated Testing, for Web or Mobile. See our Pcloudy licensing page for full details.
For more information, visit our Pcloudy product page.
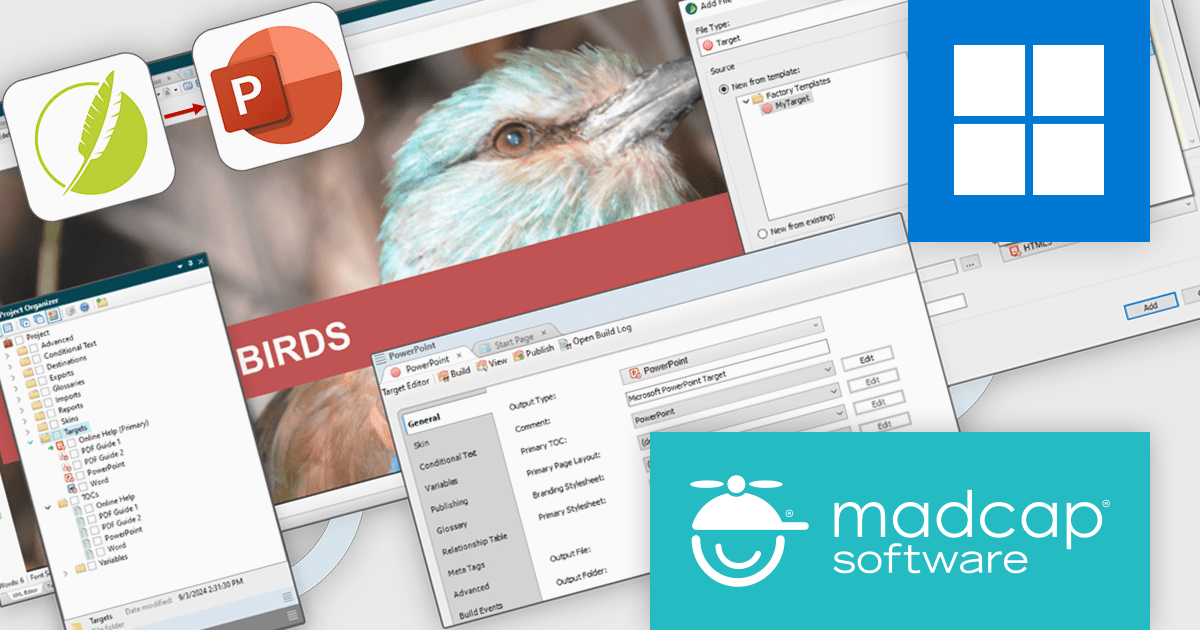
MadCap Flare is a technical authoring tool designed to streamline the creation and delivery of software documentation. It utilizes a single-source, topic-based approach, allowing developers to create reusable content that can be published in various formats, including online help systems, PDFs, and mobile apps. This facilitates efficient documentation management and ensures consistency across different outputs.
The MadCap Flare 2024 r2 release introduces a new feature that lets users generate Microsoft PowerPoint slides (PPTX) directly from Flare projects, simplifying presentation creation. By leveraging single-source reuse mechanisms like variables and snippets, users can update multiple slides simultaneously, ensuring consistency and reducing redundant work. This integration allows for easy customization, maintaining consistent branding across PowerPoint, PDFs, and online content while streamlining workflows. Teams can now collaborate more efficiently, updating content without rebranding, and boosting productivity.
To see a full list of what's new in the 2024 r2 release, see our release notes.
MadCap Flare is licensed per user as an annual subscription and includes Platinum Maintenance (upgrades and support). See our MadCap Flare licensing page for full details.
For more information, visit our MadCap Flare product page.
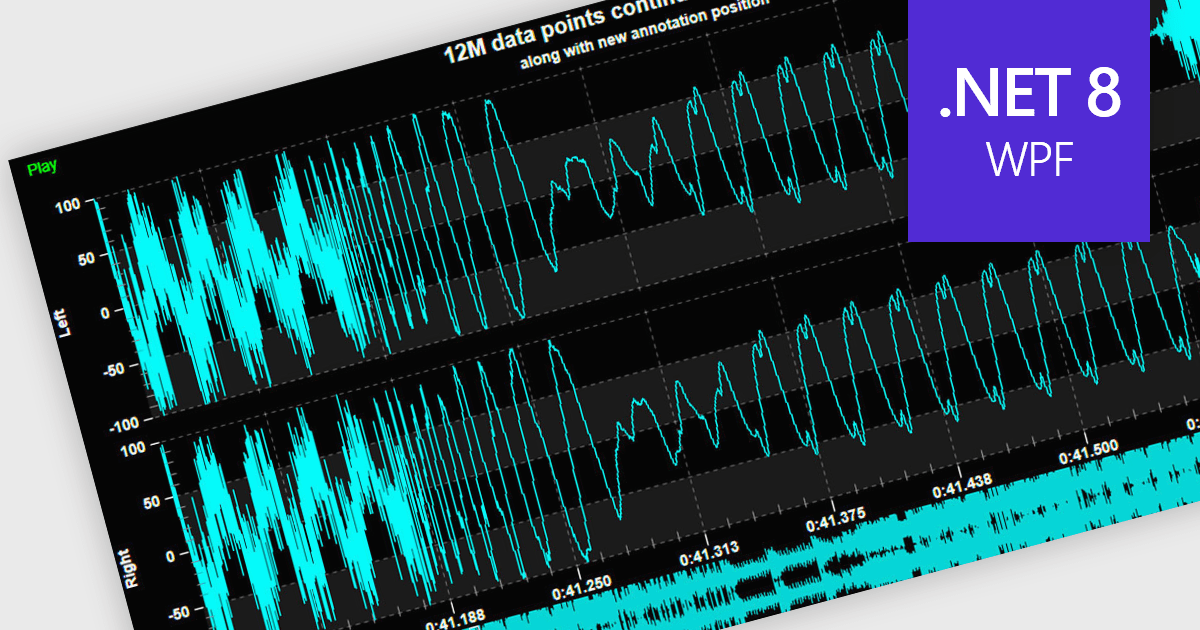
Live data support provides real-time updating of data points on a chart as new information becomes available, without the need for manual refresh or reloading. This feature allows developers to create responsive, interactive applications that can display dynamic data streams, such as financial market data, IoT sensor outputs, or real-time user metrics, directly within a chart interface. Live data enhances the user experience by providing immediate feedback and insight, improving decision-making and performance in applications that require constant data monitoring and analysis.
Several .NET 8 WPF chart controls support live data including:
For an in-depth analysis of features and price, visit our .NET 8 WPF chart controls comparison.
GitKraken is a suite of developer tools built around Git, a popular version control system. It offers a graphical user interface (GUI) that allows developers to interact with Git repositories visually instead of relying on command lines. This simplifies complex Git workflows like resolving merge conflicts and visualizing code history, making Git more accessible and efficient for developers of all experience levels.
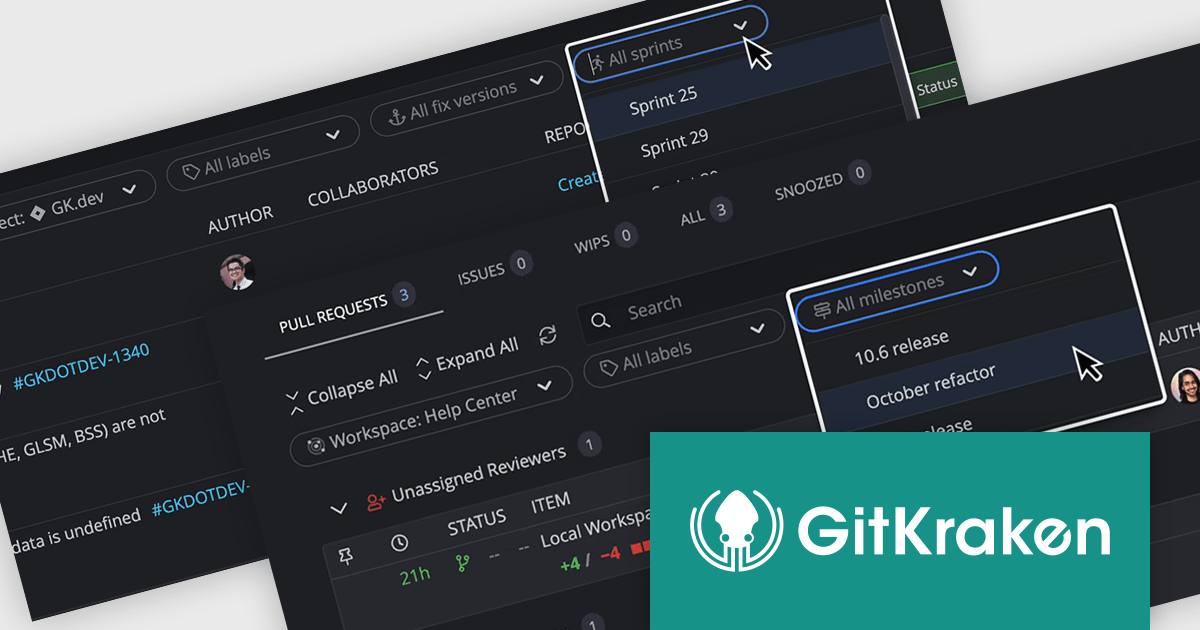
The GitKraken Desktop V10.4.0 release adds new filtering options to Launchpad that let you see specific tasks for your upcoming projects. You can filter by Jira versions and sprints, as well as GitHub and GitLab milestones. By filtering tasks, users can concentrate on the most relevant work for their current goals.
To see a full list of what's new in 10.4.0, see our release notes.
GitKraken Desktop is licensed per user as an Annual license with free updates and technical support. See our GitKraken licensing page for full details.
Learn more on our GitKraken product page.
전화 : 00798 14 800 6332
팩스 : +1 770 250 6199


