


공식 공급 업체
200 이상의 소프트웨어 개발처와 판매 계약을 맺은 공인 디스트리뷰터로서 합법적인 라이선스를 제공합니다.
모든 브랜드 보기.

Infragistics Ignite UI for Angular is a comprehensive suite of Angular components and UI controls designed to accelerate development of high-performance, enterprise-grade web applications. It offers a rich collection of data grids, charts, and other UI elements, along with advanced features like pivoting, docking, and hierarchical data management. Built on Angular, the toolkit integrates seamlessly into existing projects and provides a foundation for building modern, responsive, and interactive user interfaces.
Ignite UI for Angular's Pivot Grid now offers horizontal row dimension expansion, providing developers with greater flexibility in data visualization. In this mode, child elements of a row dimension are displayed horizontally within the same multi-row layout instead of vertically. This approach allows for a more compact and potentially informative representation of hierarchical data, enabling users to easily compare related data points within a single row context. Developers can dynamically toggle between horizontal and vertical expansion modes to suit their specific data analysis requirements.
To see a full list of what's new in version 24.1 (18.1.0), see our release notes.
Infragistics Ignite UI for Angular is part of Infragistics Ignite UI which is licensed per developer and is available as a Perpetual License with a 1, 2 or 3 year support and maintenance subscription. See our Infragistics Ignite UI licensing page for full details.
Infragistics Ignite UI for Angular is available in the following products:
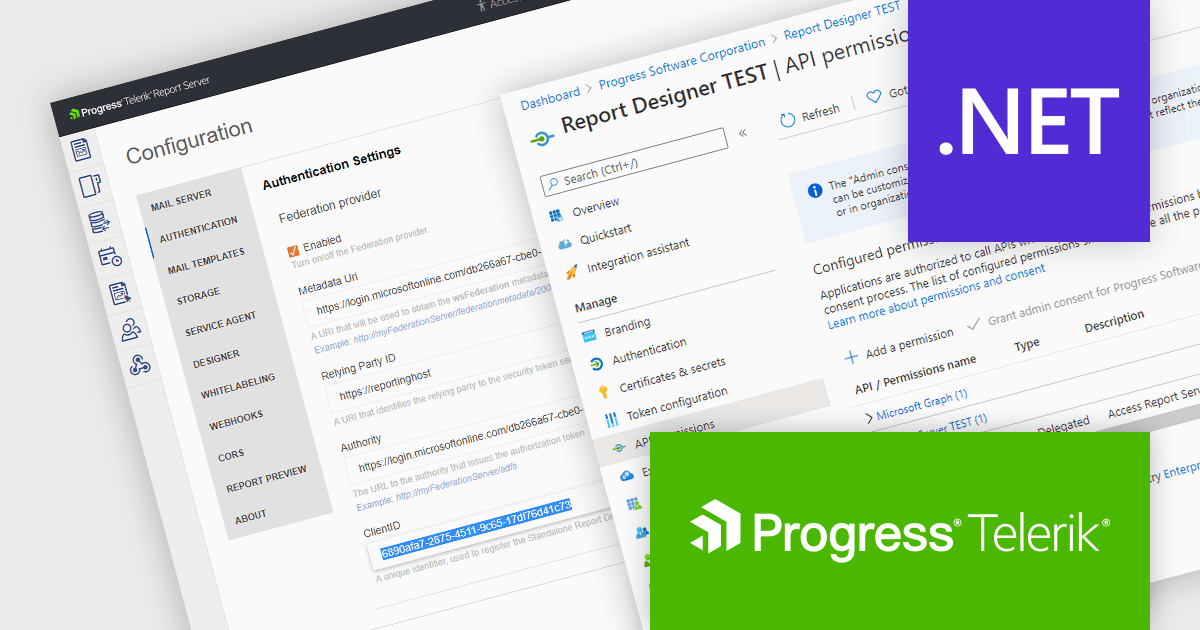
Telerik Report Server is a comprehensive and flexible end-to-end solution for managing reports. Built with the Telerik Reporting library, it is a server-based Windows web application that provides centralized storage, organization, and previewing of reports, along with features for scheduling, delivery, and user management. Report Server can act as a standalone solution or be integrated within an application, allowing developers to create, manage, and distribute reports across multiple platforms including Blazor, Angular and Windows Forms.
The Telerik Report Server 2024 Q3 update (10.2.24.806) adds support for Microsoft Entra ID as an authentication method in .NET environments. Entra ID, formerly known as Azure Active Directory, is an identity and access management solution that can now be configured as a part of the Report Server for .NET authentication methods. This integration enables single sign-on (SSO) authentication, which eliminates the need for separate credentials and improves the user experience, whilst ensuring that access to report management is tightly controlled and aligns with the broader enterprise security policies.
To see a full list of what's new in 2024 Q3 (10.2.24.806), see our release notes.
Telerik Report Server is available as a perpetual license and is licensed per domain. Each domain license contains 15 Client Access Licenses and 1 year support and maintenance. See our Telerik Report Server licensing page for full details.
Telerik Report Server is available in the following products:
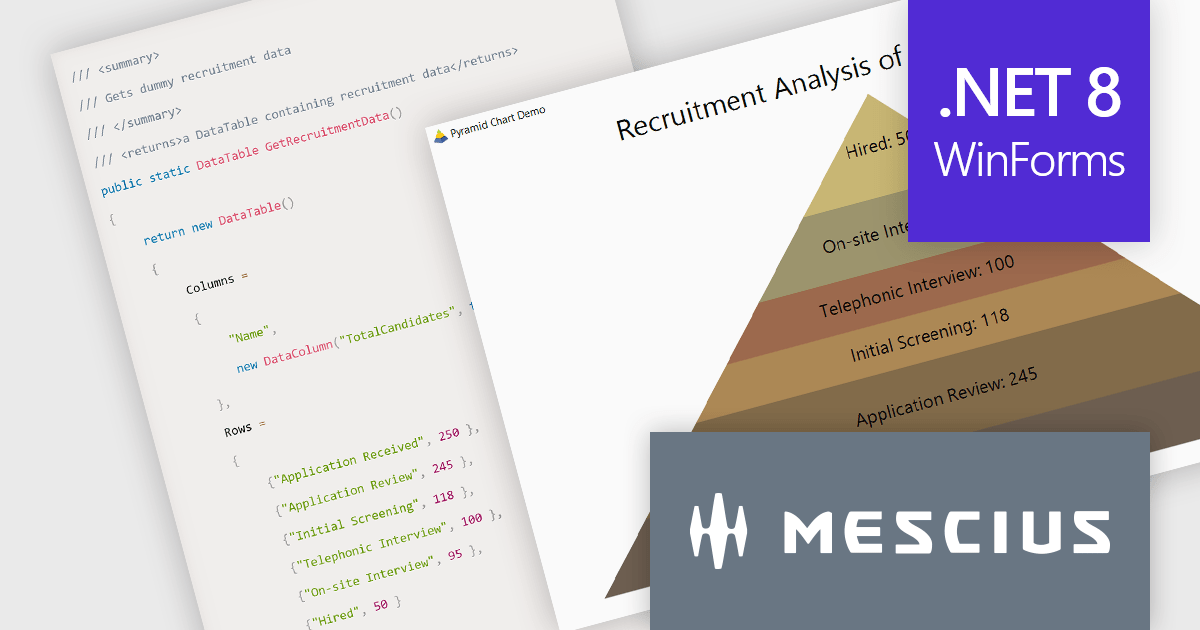
ComponentOne Studio Enterprise by MESCIUS is a comprehensive toolkit for .NET developers, offering a vast collection of pre-built UI controls for desktop (WinForms, WPF, WinUI, UWP), web (ASP.NET MVC, ASP.NET Core, MVC, Blazor), and mobile (.NET MAUI, Xamarin) applications. It extends functionality beyond UI with data visualization tools, data grids, reporting components, and JavaScript controls through Wijmo Enterprise. This all-in-one solution streamlines development by providing pre-designed elements and functionalities, allowing developers to focus on core application logic and deliver feature-rich applications faster.
In this blog post, MESCIUS Associate Software Engineer Aastha Gupta demonstrates how to use the ComponentOne FlexChart control in C# .NET to create a pyramid chart. Steps include:
Detailed sample code is included and there is even a sample app that you can download to make it easier.
Read the complete blog to get started creating stunning visualizations of hierarchical data.
ComponentOne Studio Enterprise is licensed per developer on a perpetual basis and includes a 12 month subscription. Priority Support is also available. See our ComponentOne Studio Enterprise licensing page for full details.
Learn more on our ComponentOne Studio Enterprise product page.
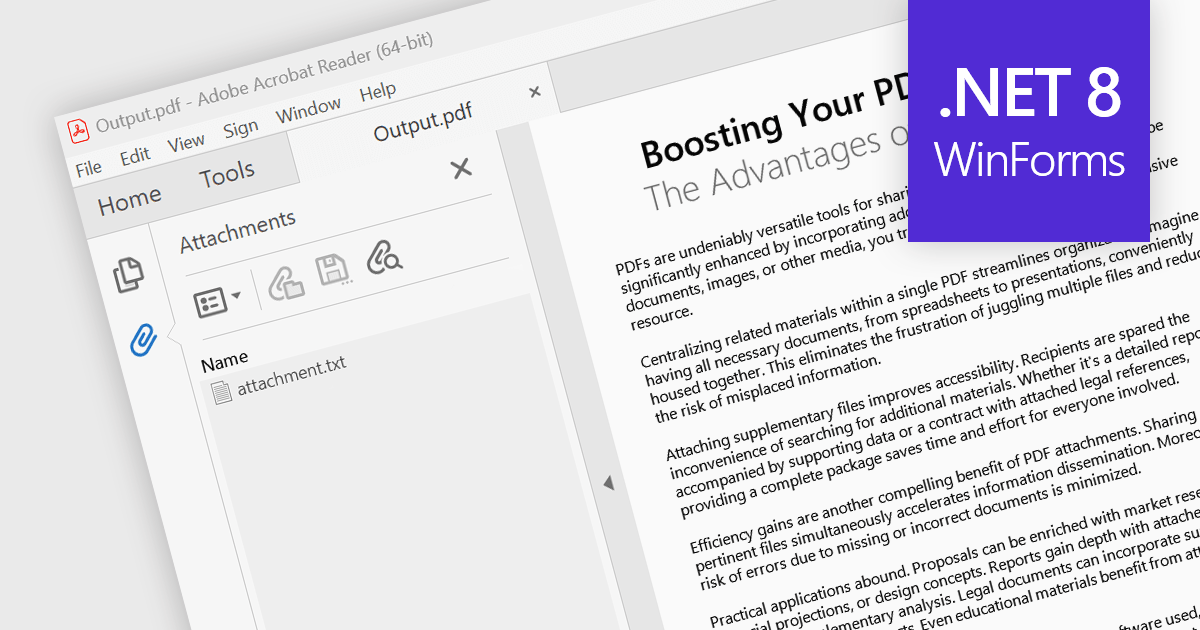
Attaching files to PDF documents involves embedding external files directly into the PDF structure. This capability offers several advantages, including consolidating related data into a single package, improving file management, and enhancing document accessibility. Practical use cases span various industries, from attaching supporting documents to invoices and contracts in business applications to embedding multimedia content like images or audio files within educational or marketing materials.
Several .NET 8 WinForms PDF components support attachments including:
For an in-depth analysis of features and price, visit our comparison of .NET 8 WinForms PDF components.
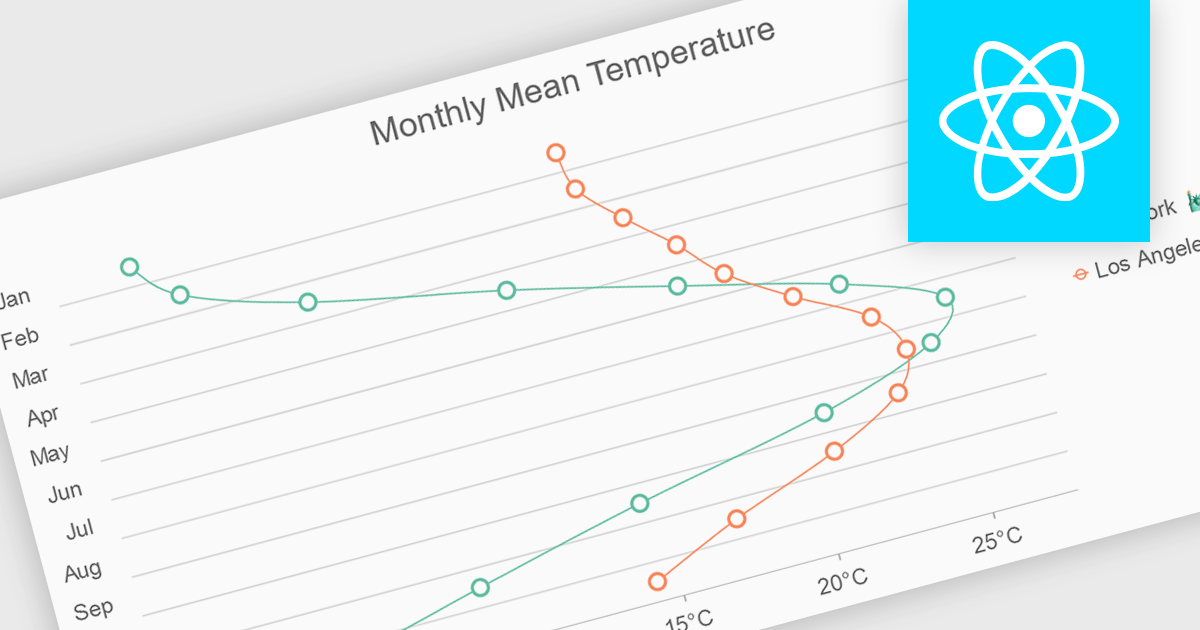
Spline charts are a type of line chart that uses smooth curves to connect data points, offering a visually appealing and intuitive representation of trends over time. Unlike traditional line charts with straight segments, spline charts emphasize the continuous nature of data, making them particularly effective for visualizing patterns, cycles, and gradual changes, commonly used in fields like finance, economics, and engineering to highlight the evolution of metrics and predict future trajectories
Several React chart controls offer spline charts including:
For an in-depth analysis of features and price, visit our React chart controls comparison.
전화 : 00798 14 800 6332
팩스 : +1 770 250 6199


