


공식 공급 업체
200 이상의 소프트웨어 개발처와 판매 계약을 맺은 공인 디스트리뷰터로서 합법적인 라이선스를 제공합니다.
모든 브랜드 보기.
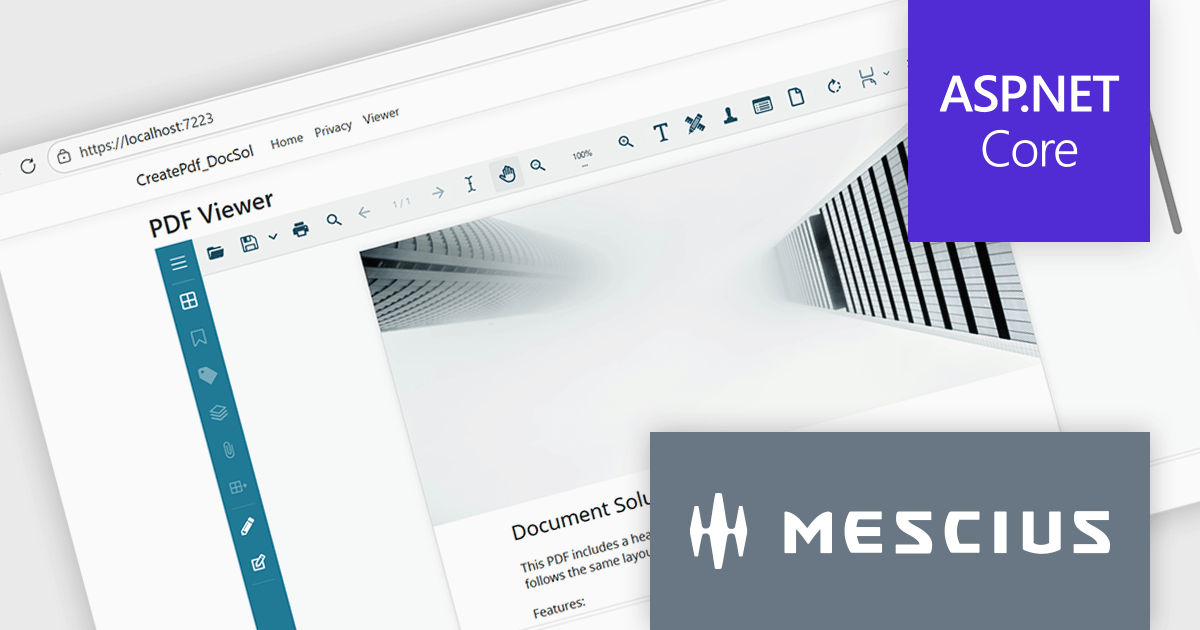
Document Solutions for PDF (DsPdf, formerly GcPdf) is a high-speed, feature-rich, server-side PDF API Library for .NET with no dependencies on Adobe Acrobat. DsPdf allows developers to programmatically create, manipulate, import/export, and deploy PDF documents, including AcroForms, across desktop and web applications at scale. With full .NET support, you can generate, load, modify, and convert PDFs in your app for .NET, Mono, Xamarin.iOS, and Xamarin.Android.
In this blog post, MESCIUS Product Specialist Kristina Ismail demonstrates how to integrate the DsPdf API library on the server side, along with the included JavaScript PDF Viewer to load, generate, and display PDF files in the browser inside an ASP.NET Core application. Steps include:
Read the complete blog to learn how to implement an end-to-end PDF workflow inside any ASP.NET Core application.
Document Solutions for PDF is licensed per developer and is available in several license options for differing distribution needs. Team licenses are also available for multiple developers within the same organization. See our Document Solutions for PDF licensing page for full details.
Document Solutions for PDF is available to buy individually or as part of Document Solutions .NET Bundle.
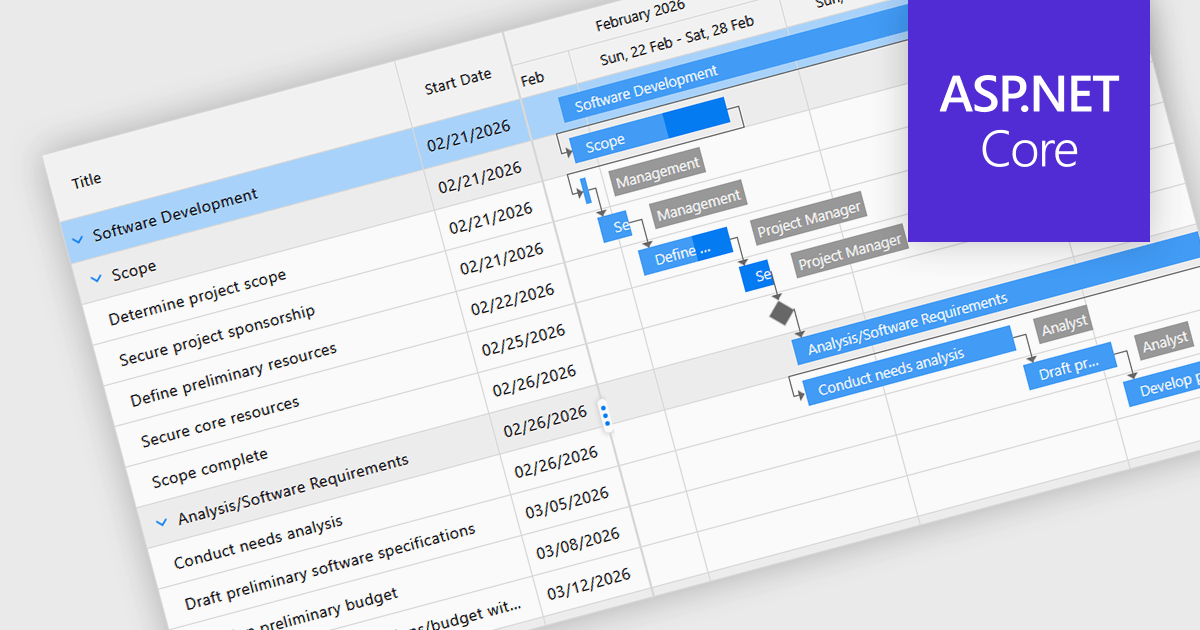
Gantt controls in ASP.NET Core UI suites are specialized components used to visualize and manage project schedules within web applications. They present tasks along a timeline in a Gantt chart format, showing start and end dates, task dependencies, progress, and resource allocation in a clear graphical view. Developers can integrate these controls to provide features such as task hierarchy, drag-and-drop scheduling, dependency linking, milestone tracking, and interactive editing directly in the browser. Many implementations also support data binding to backend services, filtering, and export capabilities, making them suitable for project management systems, planning tools, and enterprise dashboards where users need to monitor timelines and coordinate complex workflows efficiently.
Several ASP.NET Core UI Suites contain Gantt controls including:
For an in-depth analysis of features and price, visit our comparison of ASP.NET Core UI Suites.
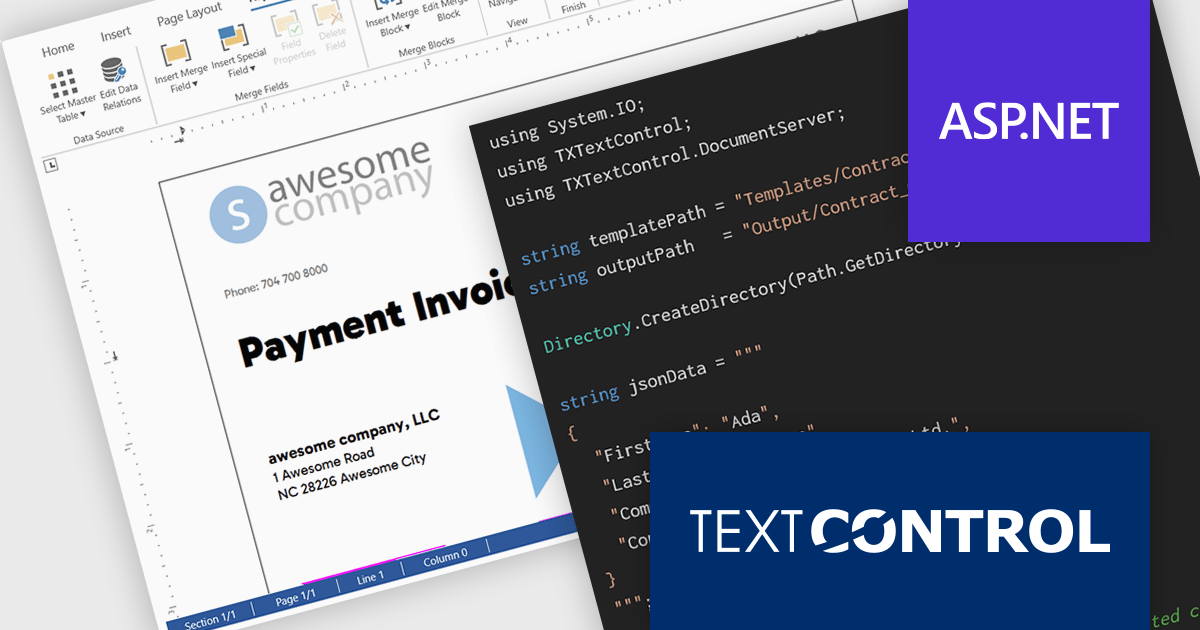
TX Text Control .NET Server for ASP.NET is a server-side component for Web applications, or services. It is a fully programmable ASP.NET word processor engine that offers an extensive palette of word processing features. Using TX Text Control .NET Server, programmers can develop server side, end user applications that generate documents on-the-fly, using data from databases, binary files (Microsoft Word DOC and DOCX), ASCII files (XML, RTF, HTML) and image data (JPG, PNG, BMP, TIF, GIF, WMF).
In this blog post, Text Control's Bjoern Meyer demonstrates how to use TX Text Control .NET Server for ASP.NET to build scalable, server-safe document automation using C# .NET. The TX Text Control native document automation engine provides many benefits over using the Microsoft Word desktop automation, including:
Read the complete blog to get started automating the generation of Word documents in your mission-critical systems.
TX Text Control .NET Server for ASP.NET is licensed per developer and is available as a Perpetual License with a 12 month support and maintenance subscription. Run time licenses are required for the deployment to production servers. See our TX Text Control .NET Server for ASP.NET licensing page for full details.
For more information, visit our TX Text Control .NET Server for ASP.NET product page.
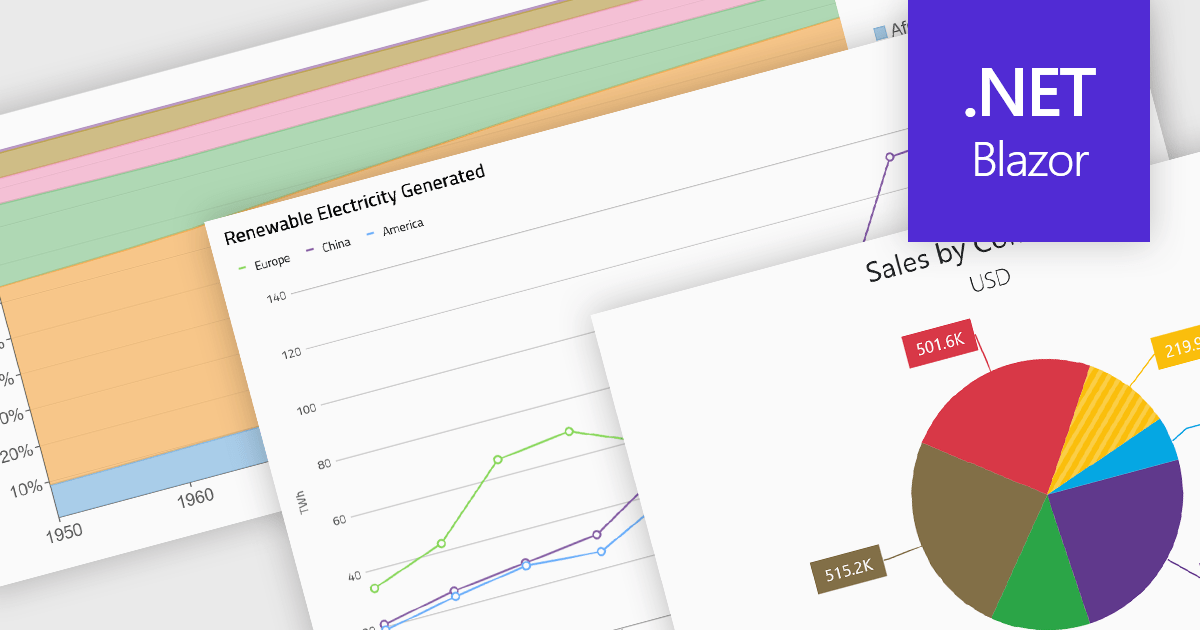
Standard chart types form the foundation of most charting components, providing widely recognized visual formats for representing numerical and categorical data. These charts help developers present trends, comparisons, distributions, and relationships in ways that are immediately understandable to end users. Because these visualizations are familiar across industries, they are commonly included as built-in options in charting libraries and dashboards, allowing applications to communicate insights clearly while supporting interactive features such as tooltips, legends, and dynamic data updates.
Common chart types include:
For an in-depth analysis of features and price, visit our Blazor charts components comparison.
A toggle switch is a user interface control that allows users to quickly switch between two states, typically on and off. It provides a clear visual indication of the current state and enables immediate changes with a single interaction. Toggle switches are widely used in forms, settings panels, and configuration interfaces because they present binary choices in a compact and easily understandable format. Their visual clarity helps reduce user errors, while their interactive design supports efficient input and consistent behavior across desktop and mobile applications.
Several .NET data editor collections give you toggle switch functionality, including:
For an in-depth analysis of features and price, visit our comparison of .NET data editor collections.
전화 : 00798 14 800 6332
팩스 : +1 770 250 6199


